
PREPAREDNESS LEVEL
1. FIRE WEATHER
A. SWCC PREDICTIVE SERVICES
DAILY FIRE POTENTIAL
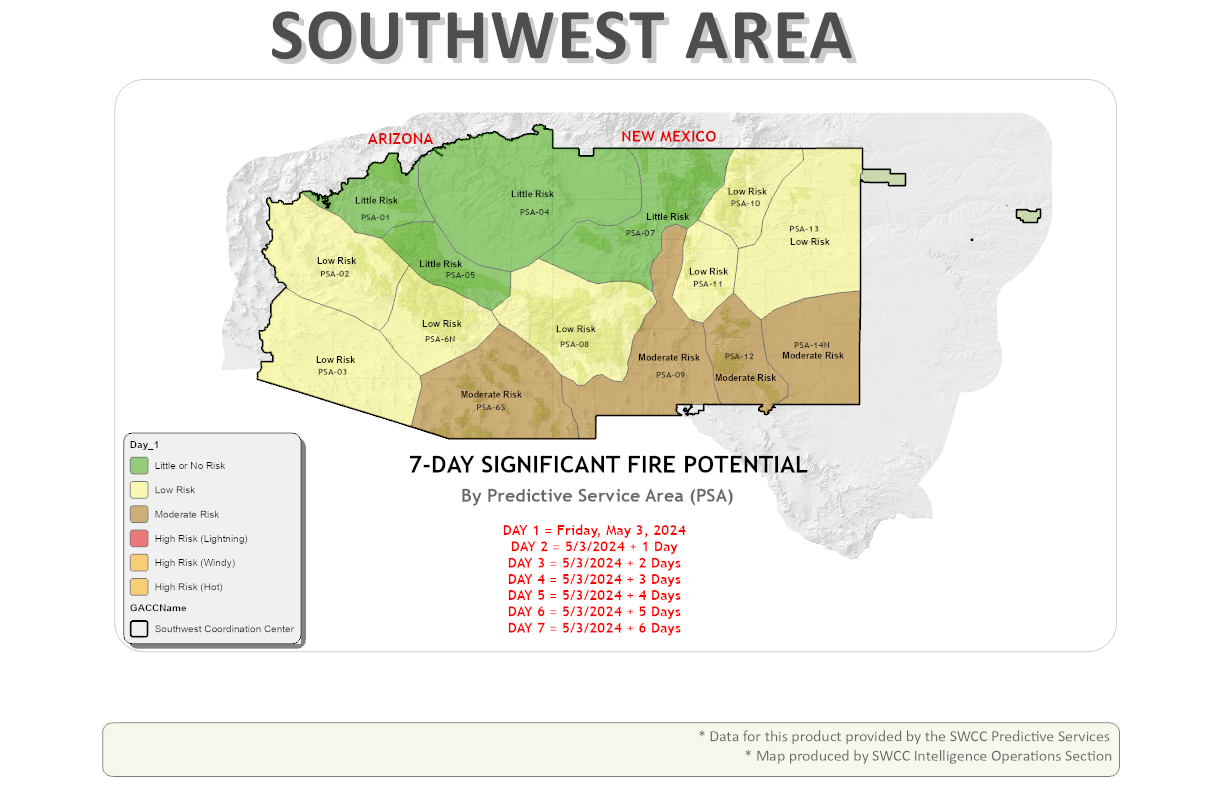
SWCC Predictive Service's "Daily Fire Weather Discussion and Fuels Potential" provided via the SWCC Predictive Service's 7-Day Fire Potential Outlook.
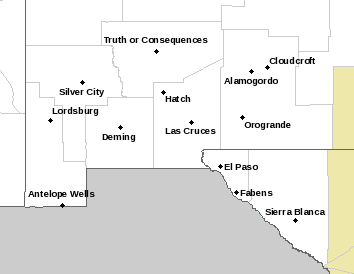
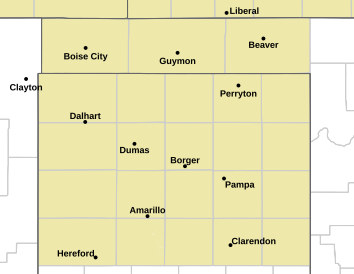
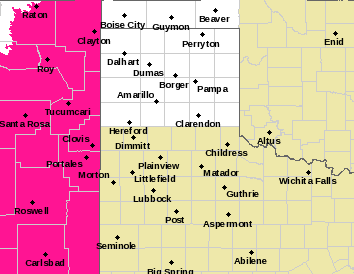
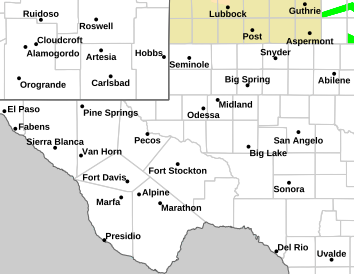
B. NATIONAL WEATHER SERVICE
WARNINGS/WATCHES/ADVISORY DATA PROVIDED BY: National Weather Service
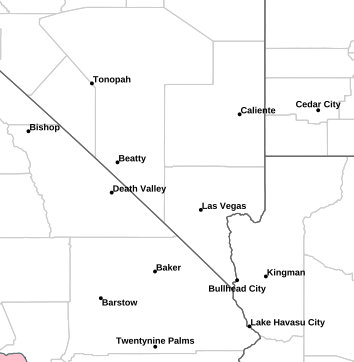
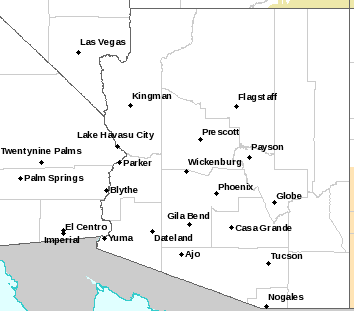
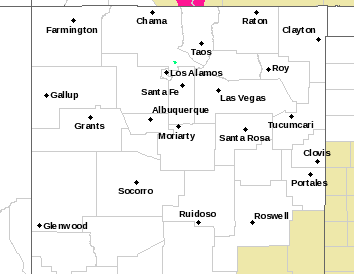
Southwest Map | Arizona | New Mexico
FW Zone Maps:
Arizona | New Mexico


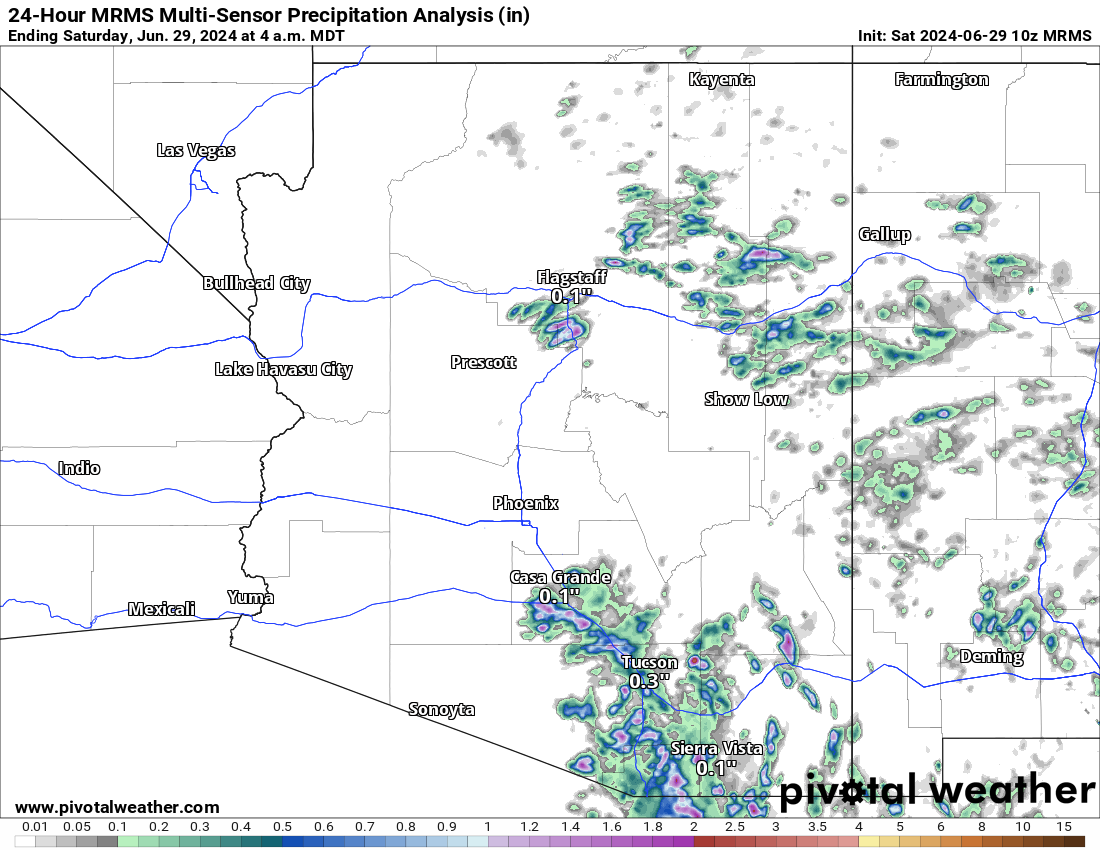
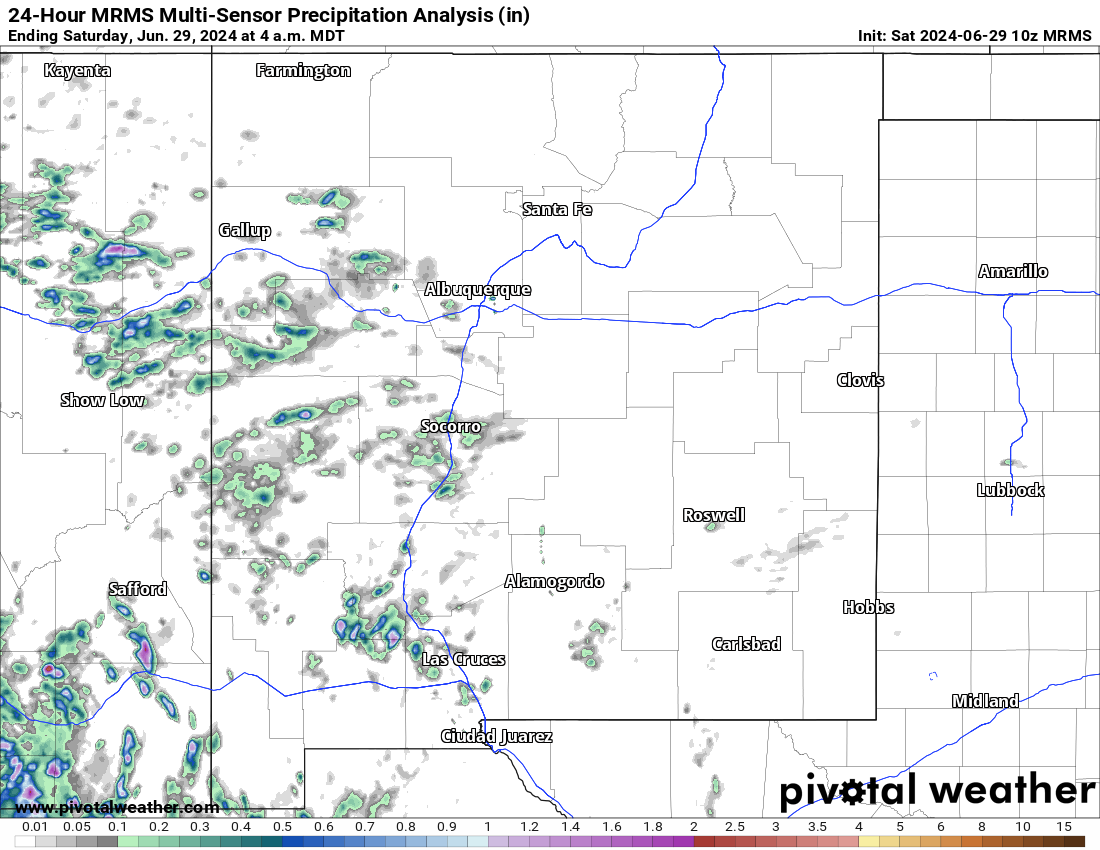
C. LIGHTNING & PRECIPITATION
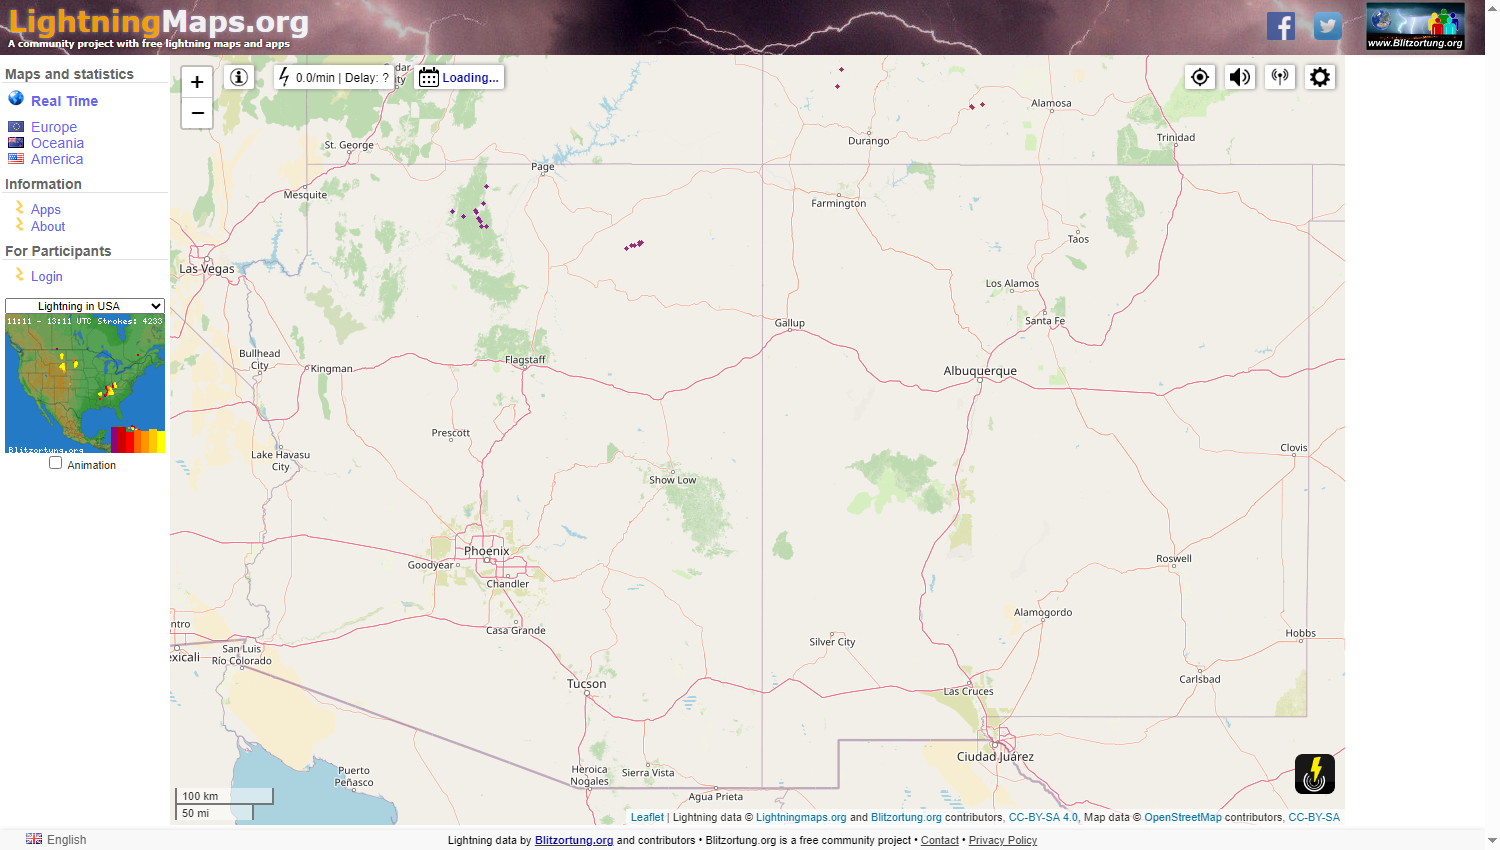
Lightning Map provided by LightningMaps.org CC BY-SA 4.0 / Lightning data by Blitzortung.org and contributors. Coverage is from yesterday at 1200 UTC - today at 1200 UTC
Precipitation Map is provided by pivotalweather with data from the NWS and covers from 1200 UTC the preceding day to 1200 UTC the date of publication. Data are averages for each PSA and provided by the MesoWest (Univ. of Utah) website and covers the past 24-48 hour period.
2. DROUGHT
A. BY STATE
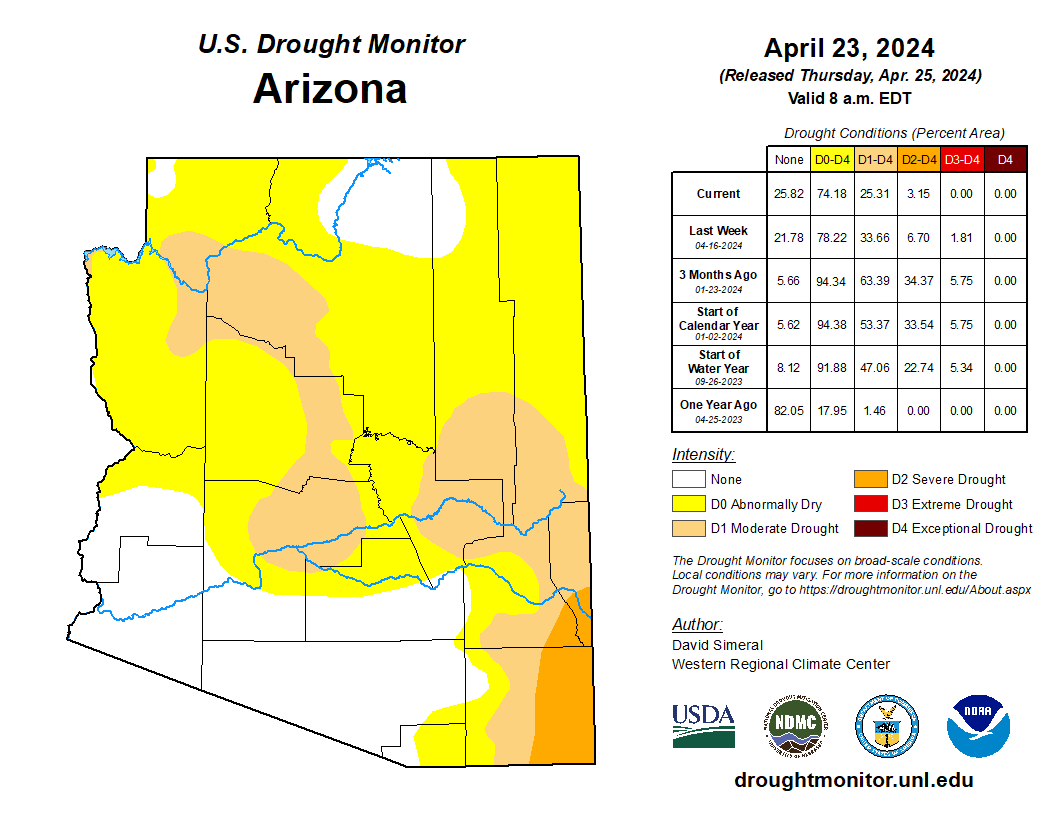
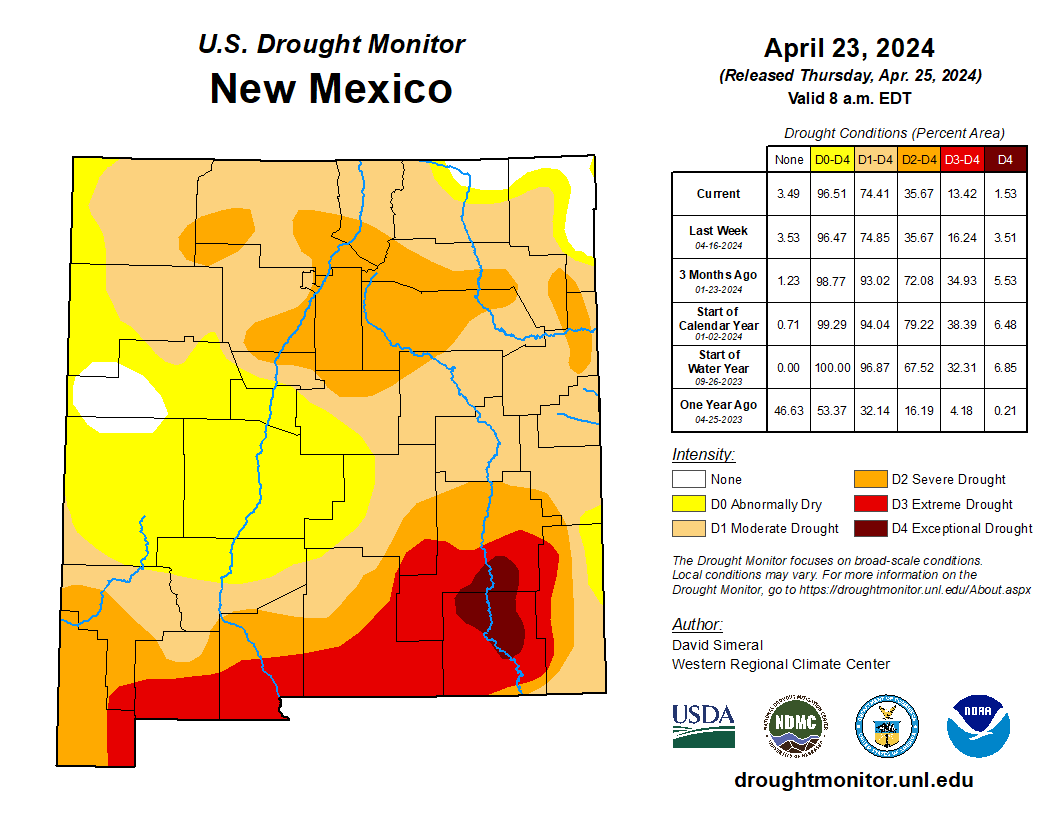
National / State Drought Maps are updated once per week.
The table above indicates the percentage of the respective States current drought status compared to one-year ago.
Drought data are provided via the National Drought Mitigation Center at the University of Nebraska - Lincoln.
3. FUEL MOISTURE
A. DEAD FUEL MOISTURE

Dead Fuel Moisture data are acquired daily via the National Weather Information System (WIMS) and the.
There are five categories for which the fuels are determined to be within:
Wet >=15%; Moist = 8.1% - 15%; Dry - 5.1% - 8.0%; Very Dry = 3.1% - 5.0%; Extremely Dry <=3.0%.
Live Fuel Moisture data are acquired via the National Fuel Moisture Database (NFMD).
C. FUELS AND FIRE BEHAVIOR ADVISORIES
4. FIRE DANGER
A. Forecasted Burn Period
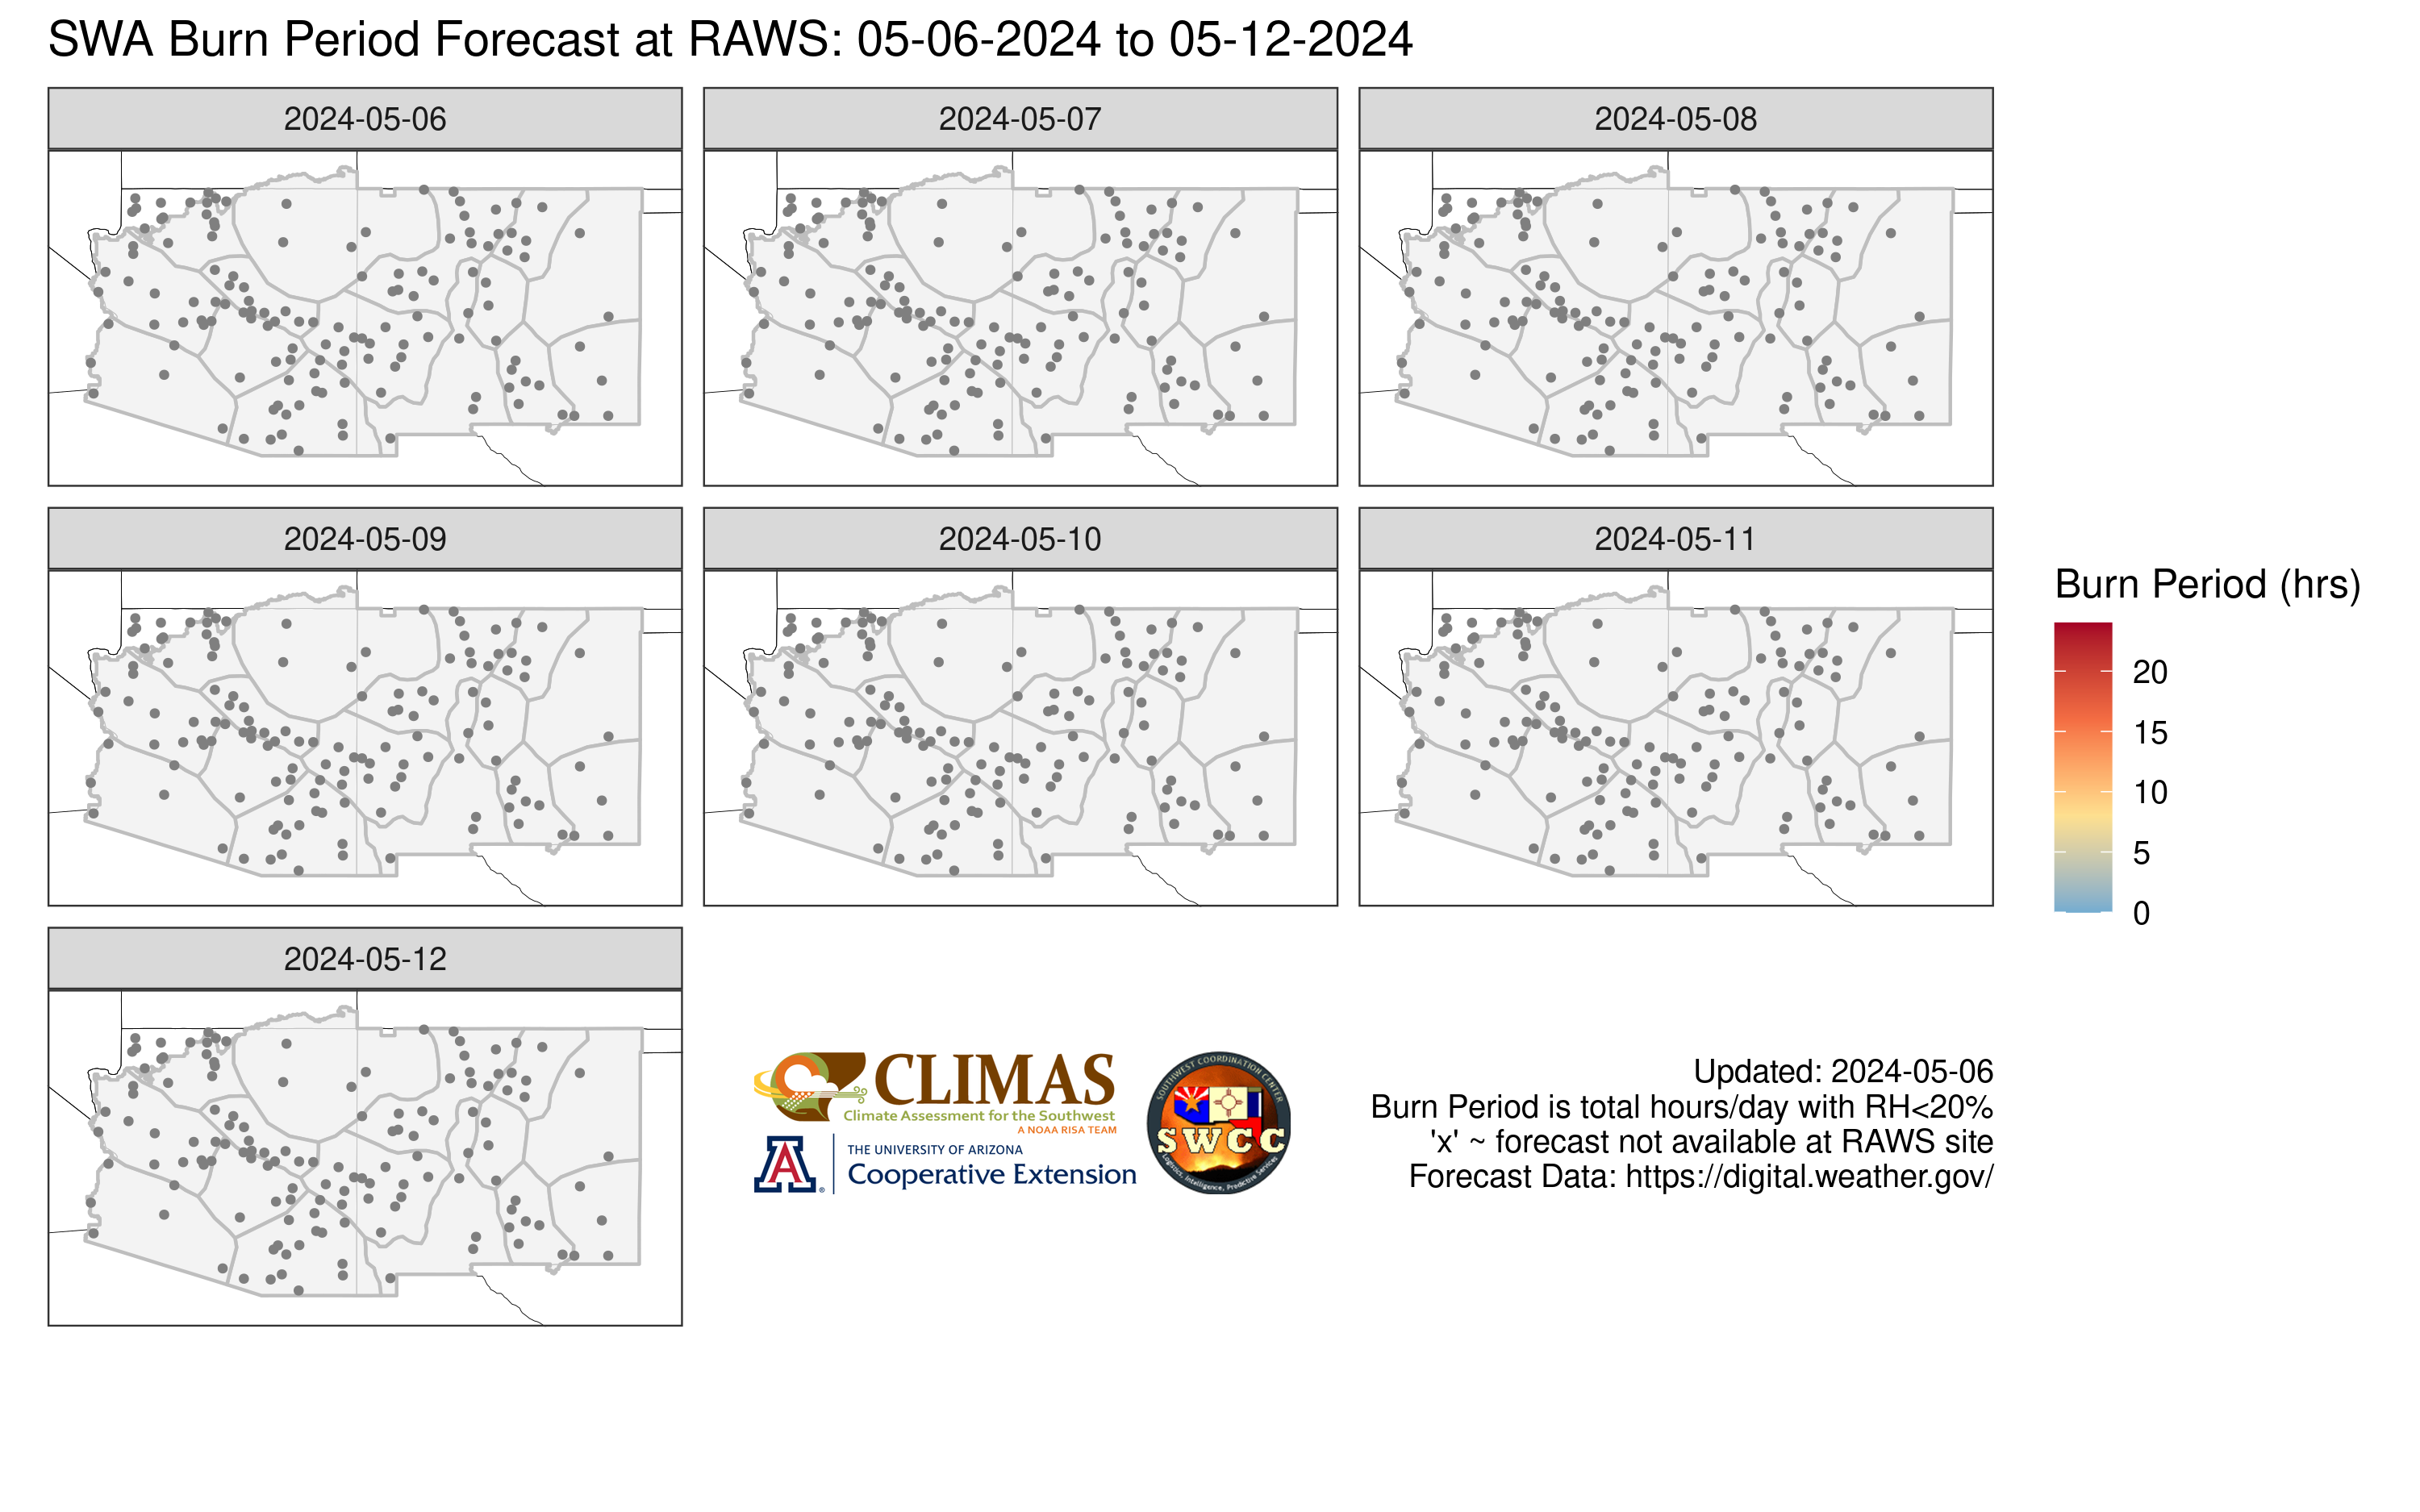
Burn Period Forecasts are provided by Arizona State University.
Observations are taken from RAWS stations and forecasted to
Low, Moderate, High, Very High, Extreme.
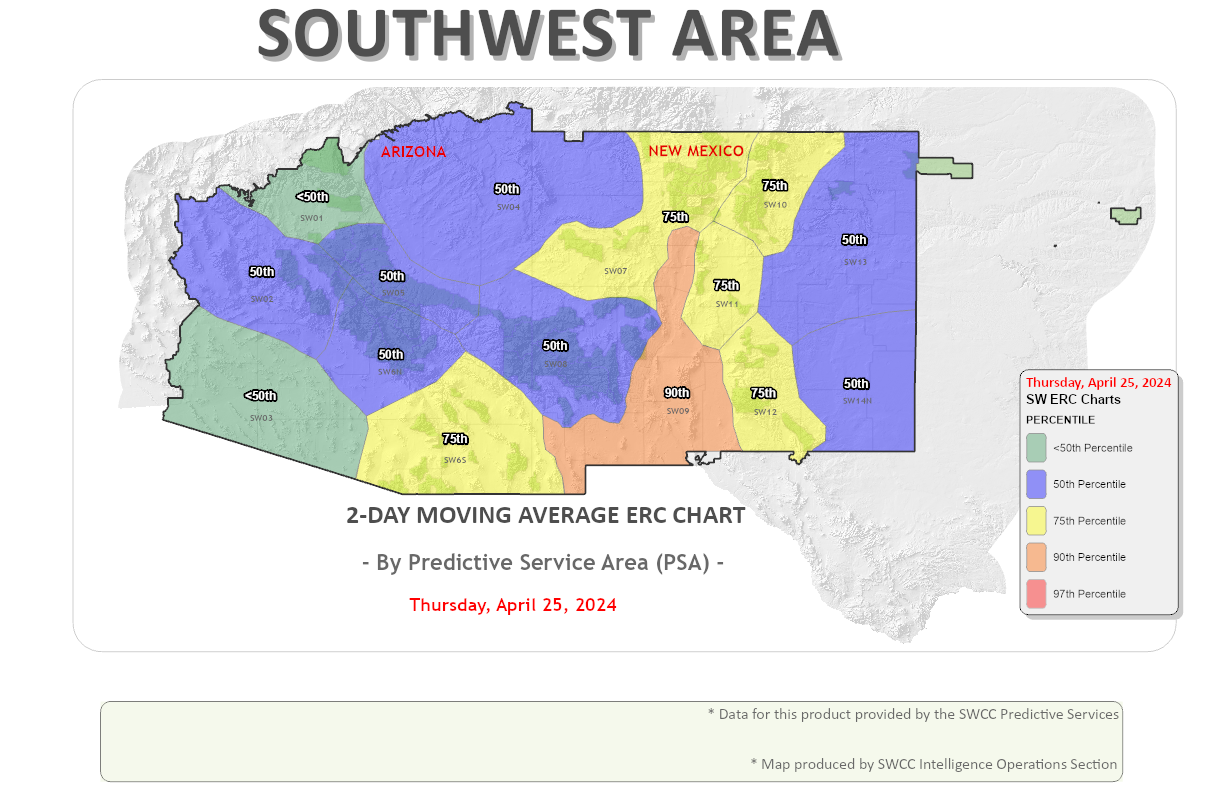
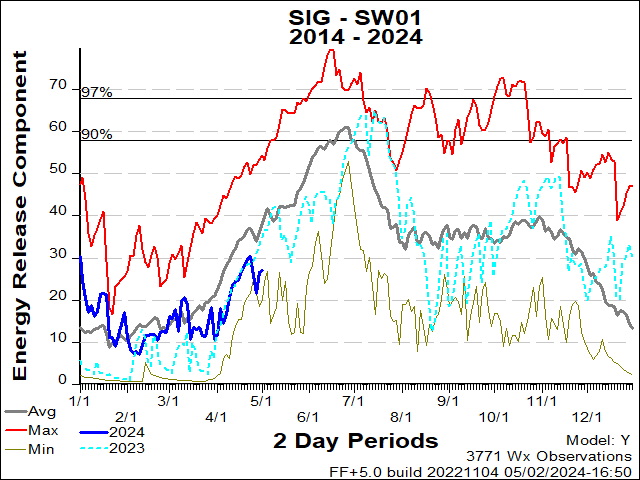
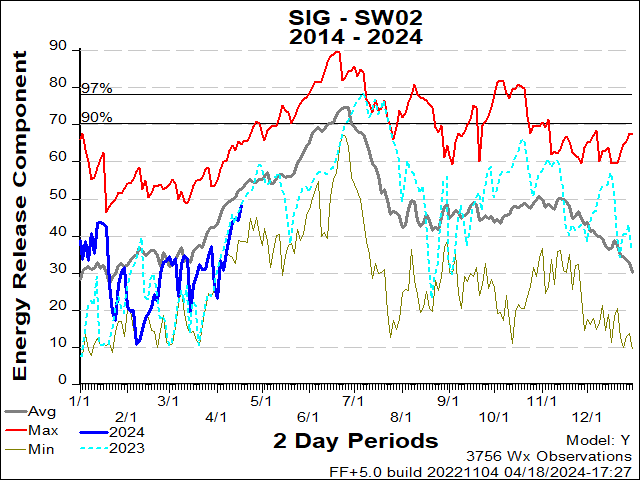
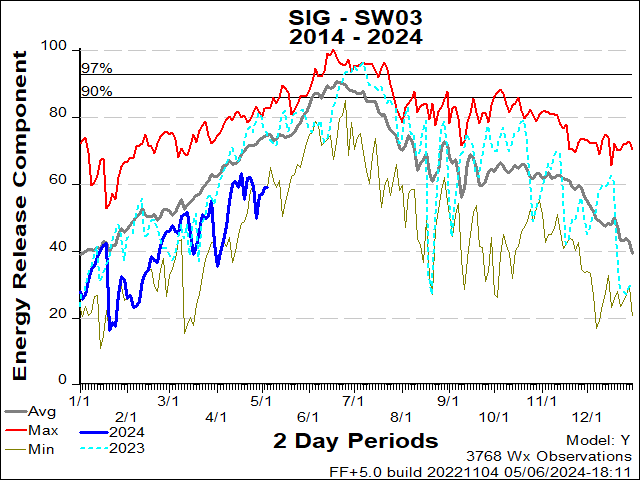
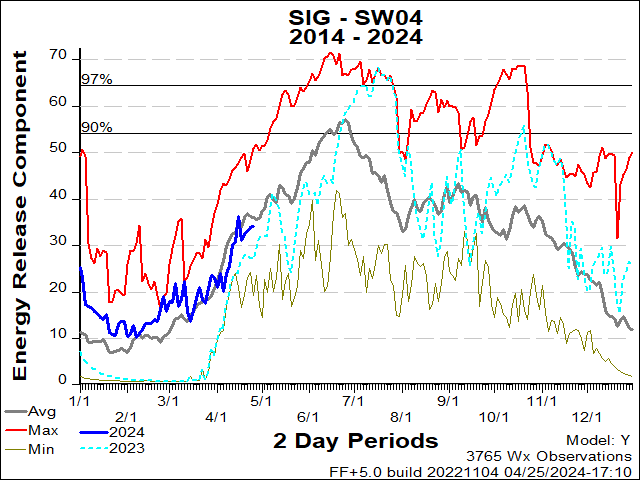
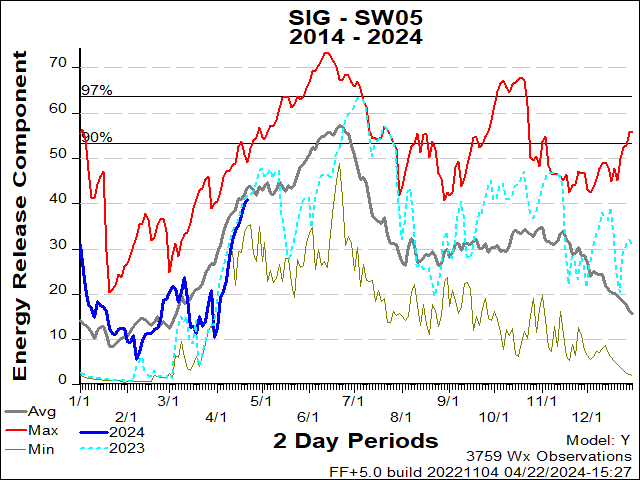
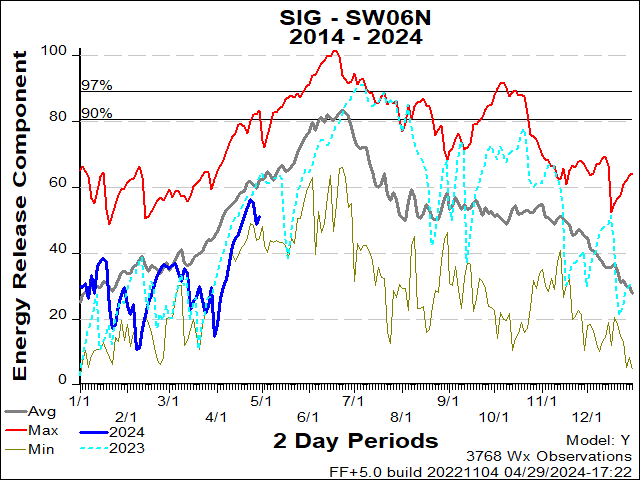
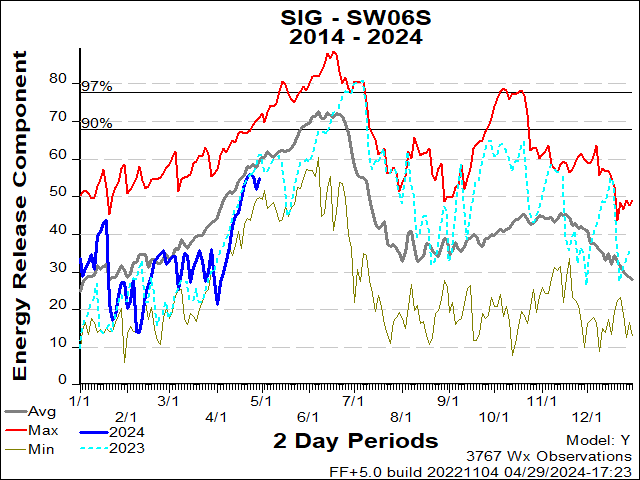
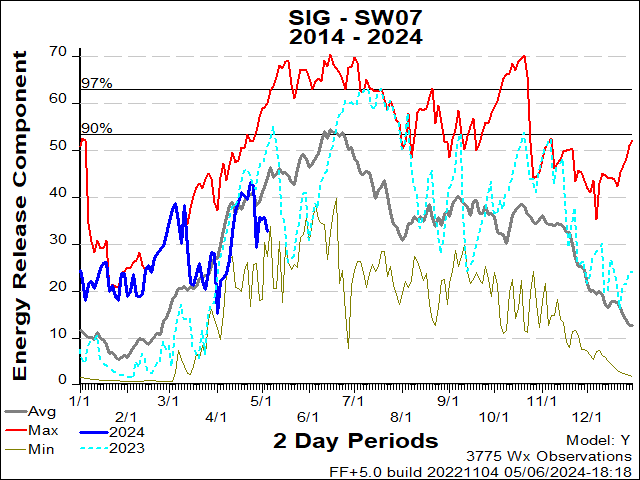
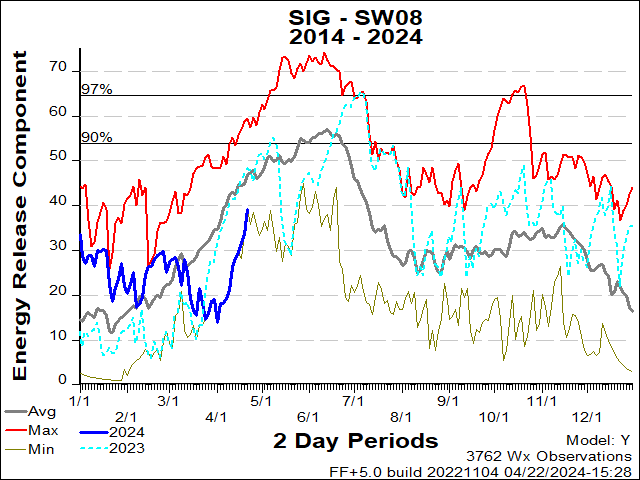
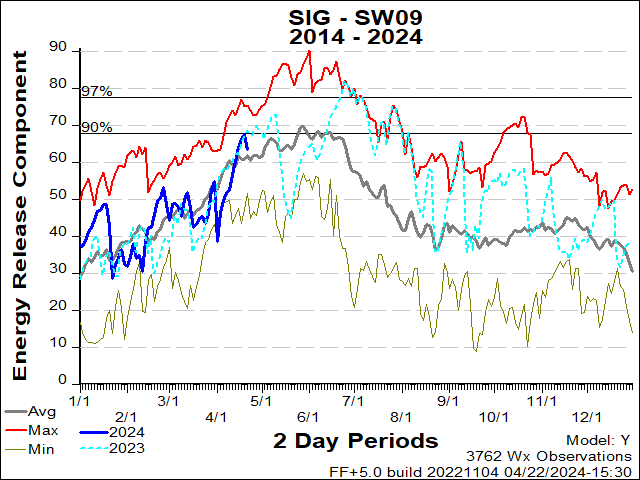
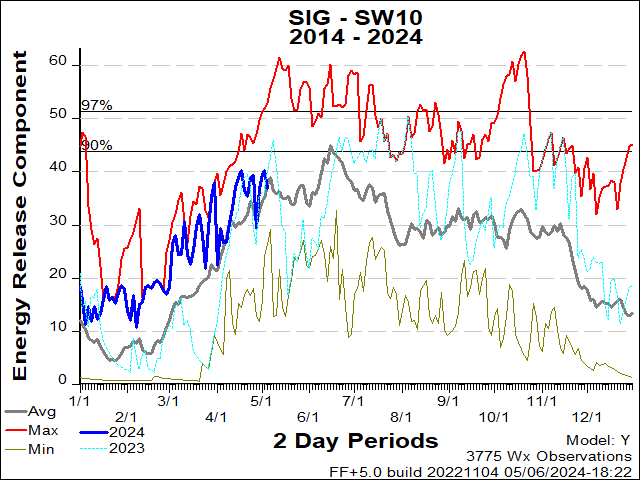
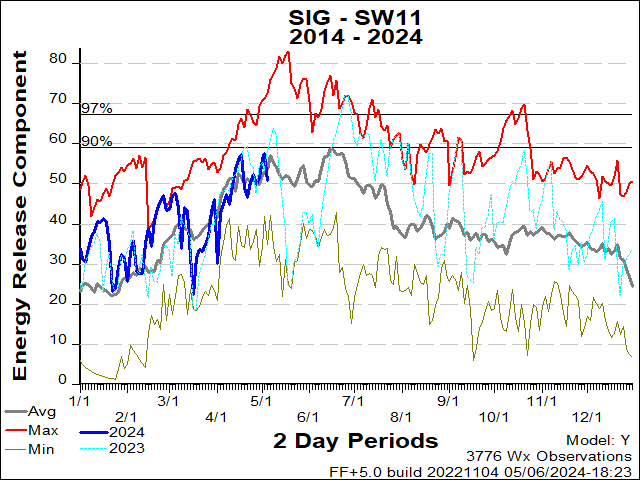
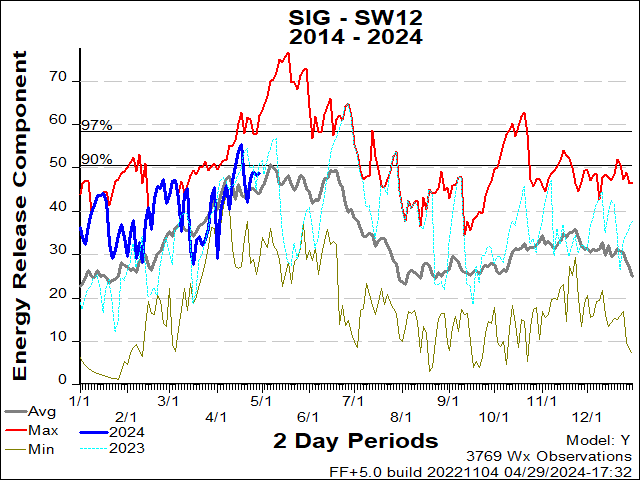
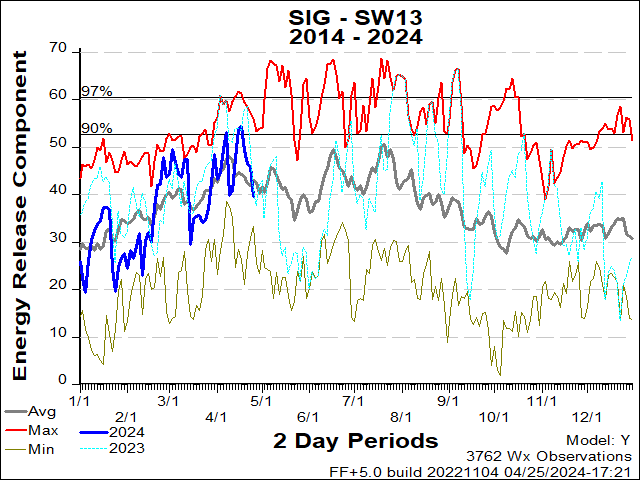
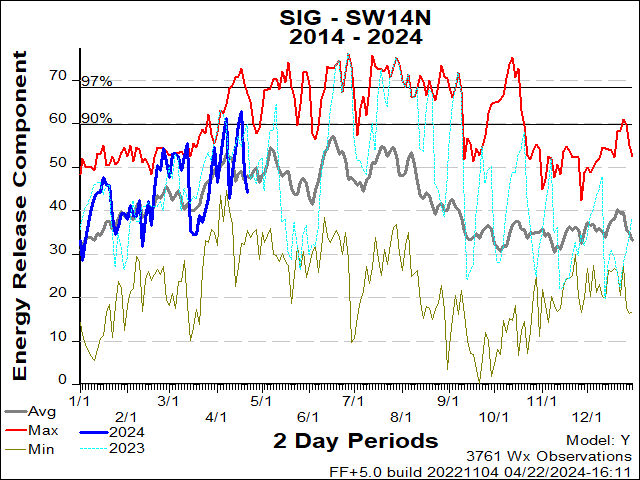
B. ENERGY RELEASE COMPONENT (ERC) CHARTS
/ WEST TEXAS |
ERC Charts are produced daily using a 2-Day Moving Average for Arizona and New Mexico. Selected fire weather stations are used in creating the State ERC Charts. PSA charts are created using available stations within the respective PSA.
C. RAWS / WIMS ADJECTIVE READINGS (BY PSA)
RAWS / WIMS Adjective Readings (By PSA) are downloaded via the National Weather Information System (WIMS) for Arizona and New Mexico to build the following table.
There are five categories defined for fire danger:
Low, Moderate, High, Very High, and Extreme
5. FIRE RESTRICTIONS
A. FIRE RESTRICTIONS (BY STATE)
6. Resource Summary
The SW Fire Environment Report (SFER) is produced by the SWCC Intelligence Section.
Click the following to Subscribe / Unsubscribe to this report.
- SOUTHWEST COORDINATION CENTER
- 333 Broadway SE
- Albuquerque, NM 87102