
NATIONAL FIRE DANGER RATING SYSTEM (NFDRS)
- Energy Release Component (ERC) Charts -
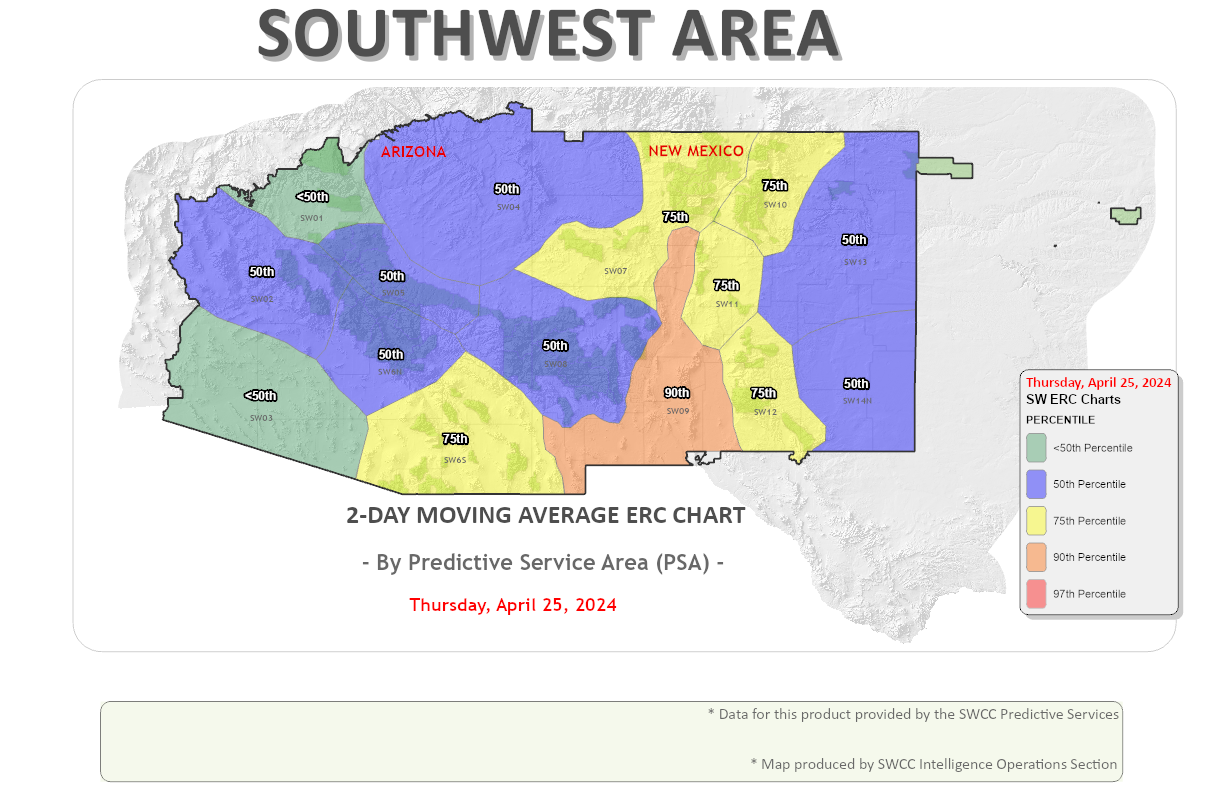
- By Predictive Service Areas (PSA) -
×
2014 - 2023 ERC Percentile Breakpoints
| PSA | 50th | 60th | 70th | 75th | 80th | 85th | 90th | 95th | 97th |
|---|---|---|---|---|---|---|---|---|---|
| SW01 | 30 | 36 | 42 | 45 | 48 | 53 | 58 | 65 | 67 |
| SW02 | 46 | 51 | 56 | 59 | 62 | 66 | 70 | 75 | 78 |
| SW03 | 66 | 70 | 74 | 76 | 79 | 82 | 86 | 90 | 92 |
| SW04 | 30 | 35 | 41 | 44 | 47 | 50 | 54 | 62 | 64 |
| SW05 | 29 | 34 | 40 | 43 | 46 | 49 | 53 | 60 | 64 |
| SW06N | 50 | 56 | 62 | 66 | 70 | 74 | 80 | 86 | 88 |
| SW06S | 42 | 48 | 54 | 56 | 60 | 63 | 68 | 75 | 78 |
| SW07 | 31 | 36 | 41 | 43 | 45 | 49 | 53 | 60 | 63 |
| SW08 | 32 | 36 | 41 | 43 | 47 | 49 | 54 | 61 | 64 |
| SW09 | 46 | 51 | 55 | 58 | 61 | 64 | 68 | 73 | 77 |
| SW10 | 26 | 30 | 33 | 35 | 38 | 40 | 44 | 48 | 51 |
| SW11 | 39 | 43 | 47 | 50 | 52 | 55 | 59 | 64 | 67 |
| SW12 | 33 | 36 | 40 | 43 | 45 | 47 | 51 | 55 | 58 |
| SW13 | 37 | 40 | 44 | 46 | 48 | 50 | 53 | 58 | 60 |
| SW14N | 42 | 46 | 50 | 51 | 53 | 56 | 60 | 66 | 68 |
- SOUTHWEST COORDINATION CENTER
- 333 Broadway SE
- Albuquerque, NM 87102