Toggle navigation
Menu
Home
National
OSCC
About
Contact
Partners
PSW Fire & Aviation
BLM Fire & Aviation
NPS Fire
BIA Fire
FWS Fire
CAL FIRE
CalOES
Site Disclaimer
Local Dispatch Centers
Camino Interagency Communication Center (Intranet)
Fortuna Interagency Communication Center (Intranet)
Grass Valley Interagency Command Center (Intranet)
Modoc Interagency Communication Center
Mendocino Dispatch Center (Intranet)
Plumas Dispatch Center (Intranet)
Redding Interagency Communication Center (Intranet)
Susanville Interagency Fire Center
Yreka Interagency Communication Center (USDA/Internal)
Incident Information
Inciweb
CAL FIRE Incident Information
Predictive Services
Intelligence
Weather
Fuels/Fire Danger
Outlooks
Analysis
LOGISTICS/ DISPATCH
Aviation
Crews
Equipment / Supplies
Overhead
Visitor Information
CA Standards for Mobilization (CISRM)
Administrative
California Wildfire Coordination Group
Policy and Reports
Incident Business Management
Safety
Training
Software Applications
Related Links
National
Regional
GACC and ECC Directory
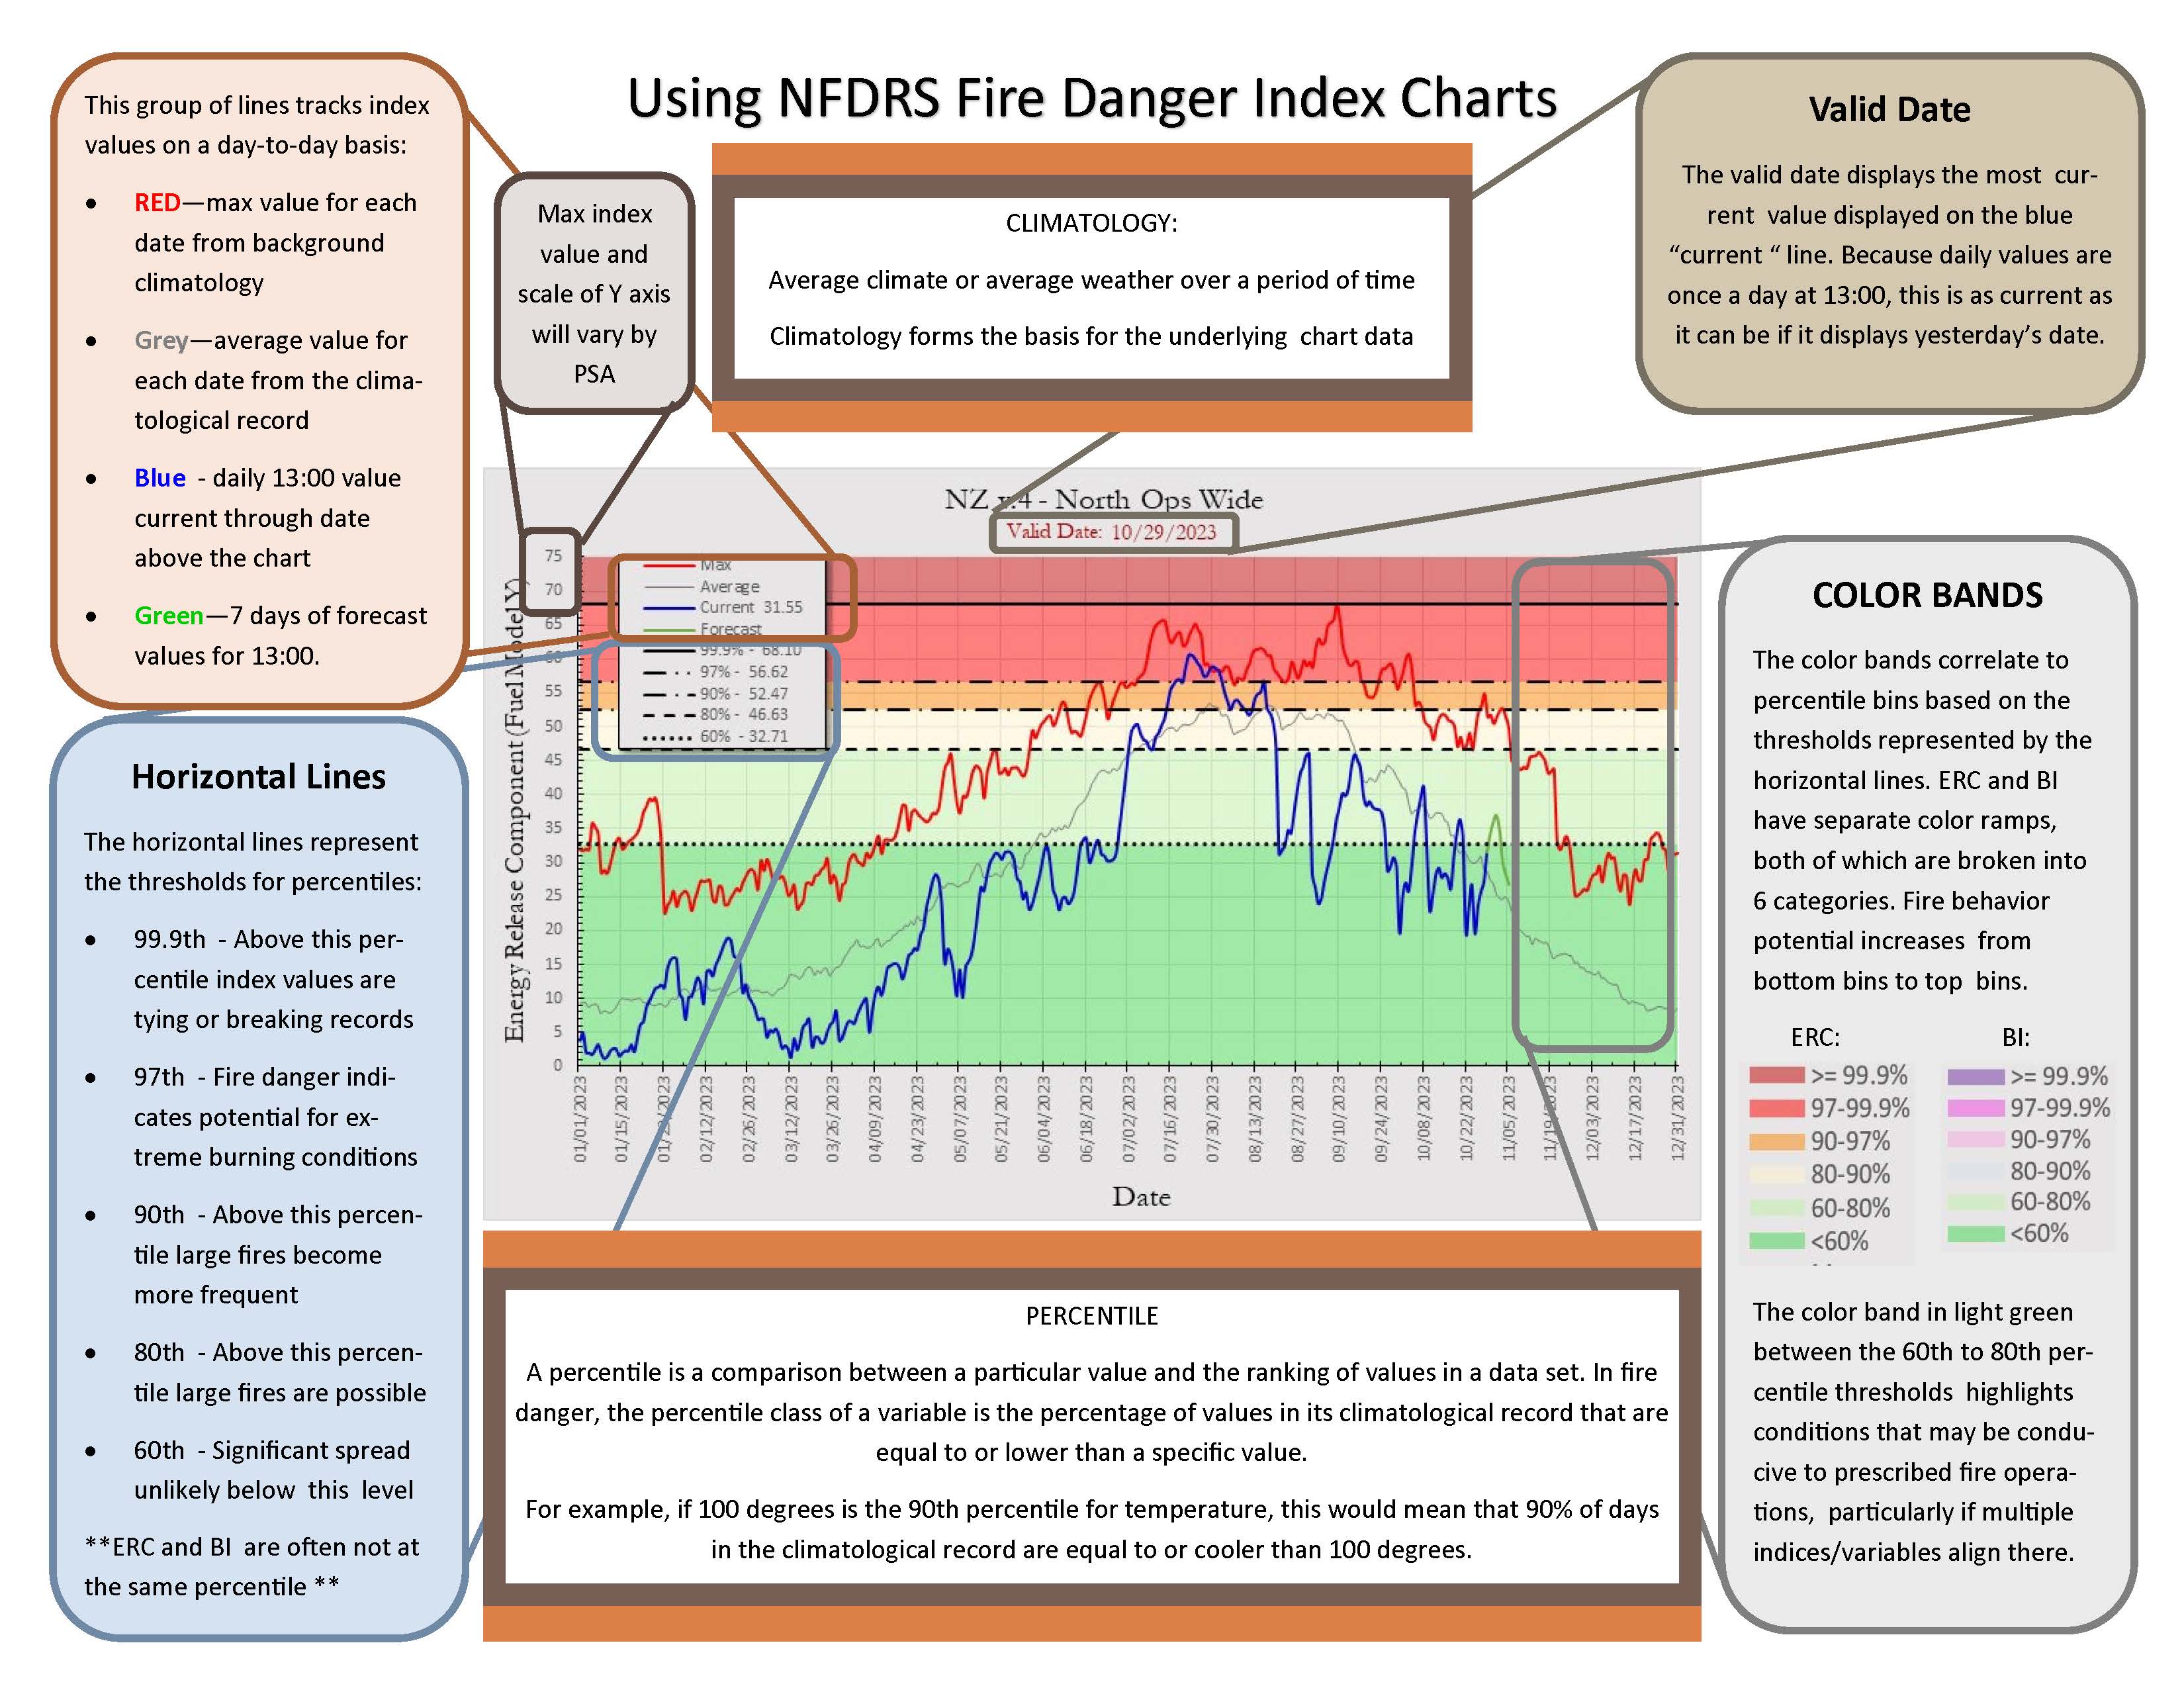
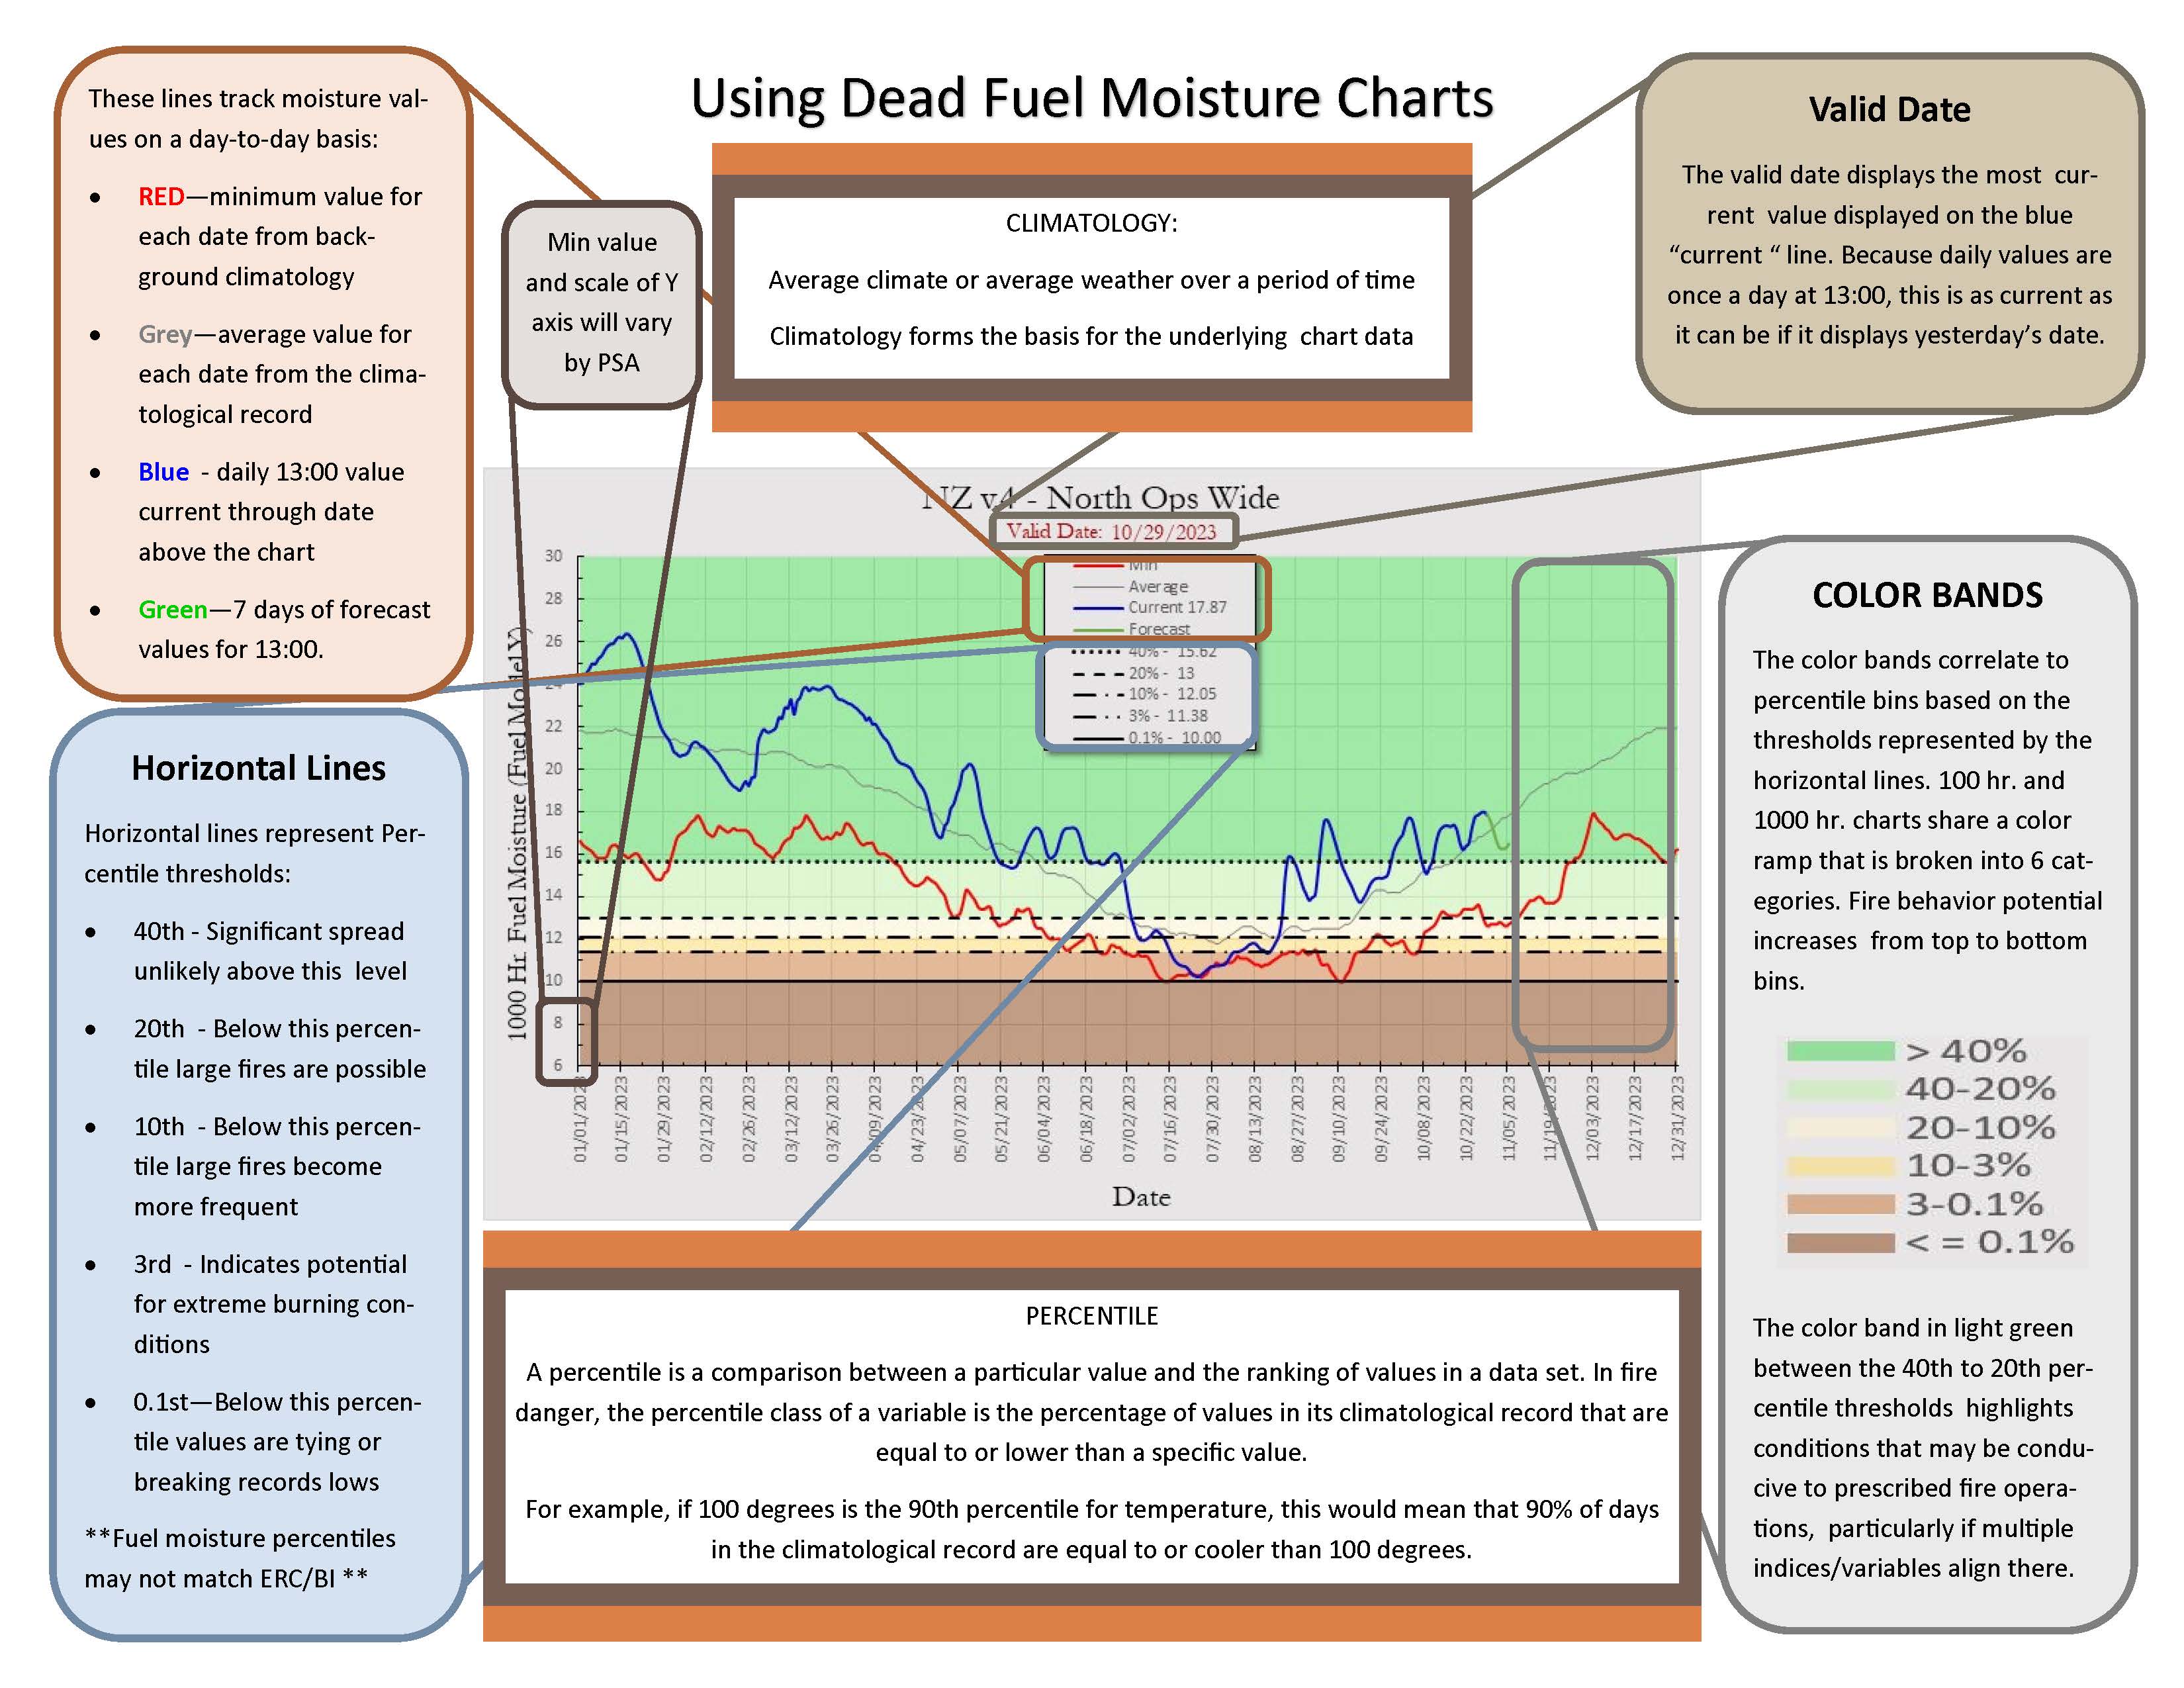
North Ops Fuels and Fire Danger Index Charts:
Fuel Model Y with 7-day Forecast Data
Climatological Percentiles, Averages, and Extremes based on 17 years of data, 2005-2025
Using NFDRS Index Charts Using Dead Fuel Fuel Charts
Full Page View CA NFDRS Dashboard 3.0 FEMS
Full Page RMA ERC and BI Percentiles
Individual Predictive Service Area (PSA) Charts
- NEW FEMS
ERC's -- Choose a PSA:
NC01 North Coast
NC02 Mid Coast to Mendocino
NC03A Bay Marine
NC03B Diablo / Santa Cruz
NC04 Northwest Mountains
NC05 Sac. Valley / Foothills
NC06 NE California
NC07 Northern Sierra
NC08 Far Eastside
NZ
Burning Index (BI) -- Choose a PSA:
NC01 North Coast
NC02 Mid Coast to Mendocino
NC03A Bay Marine
NC03B Diablo / Santa Cruz
NC04 Northwest Mountains
NC05 Sac. Valley / Foothills
NC06 NE California
NC07 Northern Sierra
NC08 Far Eastside
NZ
100 Hour Dead Fuel Moisture -- Choose a PSA:
NC01 North Coast
NC02 Mid Coast to Mendocino
NC03A Bay Marine
NC03B Diablo / Santa Cruz
NC04 Northwest Mountains
NC05 Sac. Valley / Foothills
NC06 NE California
NC07 Northern Sierra
NC08 Far Eastside
NZ
1,000 Hour Dead Fuel Moisture -- Choose a PSA:
NC01 North Coast
NC02 Mid Coast to Mendocino
NC03A Bay Marine
NC03B Diablo / Santa Cruz
NC04 Northwest Mountains
NC05 Sac. Valley / Foothills
NC06 NE California
NC07 Northern Sierra
NC08 Far Eastside
NZ
Full Page Views by Index
- NEW FEMS
Full Page Option
Energy Release Component
Burning Index
100 Hour Dead Fuel Moisture
1,000 Hour Dead Fuel Moisture
Individual Station Charts
- NEW FEMS
ERC's -- Choose a Station:
NC01 - 40102 (GASQUET 2)
NC01 - 40421 (EEL RIVER CAMP)
NC01 - 40425 (SCHOOLHOUSE)
NC01 - 40427 (NOTCHKO)
NC01 - 40428 (WESTSIDE)
NC01 - 40429 (KNEELAND)
NC02 - 41001 (BOONVILLE)
NC02 - 41005 (EEL RIVER (MNF))
NC02 - 41015 (RODEO VALLEY)
NC02 - 41018 (MENDOCINO PASS)
NC02 - 41101 (ALDER SPRINGS)
NC02 - 41402 (HIGH GLADE LOOKOUT)
NC02 - 41406 (SODA CREEK)
NC02 - 41411 (KONOCTI)
NC02 - 42010 (HAWKEYE)
NC02 - 42108 (ATLAS PEAK)
NC03A - 42308 (BARNABY)
NC03A - 42309 (WOODACRE)
NC03A - 42310 (BIG ROCK)
NC03A - 42312 (MIDDLE PEAK)
NC03A - 43009 (LAS TRAMPAS)
NC03A - 43304 (LA HONDA)
NC03A - 43309 (PULGAS)
NC03A - 43402 (OAKLAND NORTH)
NC03A - 43403 (OAKLAND SOUTH)
NC03A - 43802 (CORRALITOS)
NC03B - 43008 (BLACK DIAMOND)
NC03B - 43011 (MALLORY RIDGE)
NC03B - 43013 (LOS VAQUEROS)
NC03B - 43404 (ROSE PEAK)
NC03B - 43407 (ALTAMONT)
NC03B - 43502 (DIABLO GRANDE)
NC03B - 43809 (BEN LOMOND)
NC04 - 40101 (CAMP SIX)
NC04 - 40105 (SHIP MTN)
NC04 - 40203 (BLUE RIDGE (KNF))
NC04 - 40217 (MT. SHASTA)
NC04 - 40218 (OAK KNOLL)
NC04 - 40222 (SAWYERS BAR)
NC04 - 40225 (SLATER BUTTE)
NC04 - 40231 (SOMES BAR)
NC04 - 40237 (COLLINS BALDY)
NC04 - 40239 (QUARTZ HILL)
NC04 - 40244 (ASH CREEK)
NC04 - 40245 (CALLAHAN #2)
NC04 - 40246 (DUTCH-INDY)
NC04 - 40408 (HOOPA)
NC04 - 40501 (BIG BAR)
NC04 - 40503 (HAYFORK)
NC04 - 40507 (MAD RIVER)
NC04 - 40508 (RUTH)
NC04 - 40511 (YOLLA BOLLA)
NC04 - 40512 (FRIEND MTN.)
NC04 - 40516 (TRINITY CAMP)
NC04 - 40517 (SCORPION)
NC04 - 40518 (BACKBONE)
NC04 - 40519 (UNDERWOOD)
NC04 - 40520 (FIVE CENT)
NC04 - 40614 (SUGARLOAF (SHF))
NC04 - 40618 (SIMS)
NC05 - 40611 (REDDING)
NC05 - 40615 (WHITMORE)
NC05 - 40802 (EAGLE PEAK)
NC05 - 40812 (PATTYMOCUS)
NC05 - 40814 (CORNING)
NC05 - 40816 (THOMES CREEK)
NC05 - 41201 (BANGOR)
NC05 - 41211 (COHASSET)
NC05 - 41410 (COUNTY LINE)
NC05 - 41503 (STONYFORD)
NC05 - 41907 (LINCOLN)
NC05 - 42202 (BROOKS)
NC06 - 40221 (ROUND MOUNTAIN)
NC06 - 40228 (WEED AIRPORT)
NC06 - 40233 (INDIAN WELL)
NC06 - 40240 (JUANITA LAKE)
NC06 - 40242 (BRAZIE RANCH)
NC06 - 40243 (VAN BREMMER)
NC06 - 40247 (BOLAM)
NC06 - 40302 (BLUE MOUNTAIN)
NC06 - 40306 (TIMBER MOUNTAIN)
NC06 - 40308 (JUNIPER CREEK)
NC06 - 40309 (DEVILS GARDEN)
NC06 - 40312 (RUSH CREEK)
NC06 - 40313 (BEAR FLAT)
NC06 - 40314 (COLD SPRINGS)
NC06 - 40630 (SOLDIER MTN)
NC07 - 40609 (MANZANITA LAKE)
NC07 - 40635 (OAK MOUNTAIN)
NC07 - 40703 (BOGARD R.S.)
NC07 - 40719 (WESTWOOD)
NC07 - 40723 (LADDER BUTTE)
NC07 - 40730 (GORDON)
NC07 - 40801 (COLBY MOUNTAIN)
NC07 - 40904 (CHESTER)
NC07 - 40910 (QUINCY RD)
NC07 - 40915 (PIERCE)
NC07 - 40916 (CASHMAN)
NC07 - 40921 (DENTEN CREEK)
NC07 - 41213 (CARPENTER RIDGE)
NC07 - 41214 (JARBO GAP)
NC07 - 41304 (SADDLEBACK)
NC07 - 41701 (PIKE COUNTY LOOKOUT)
NC07 - 41806 (WHITE CLOUD)
NC07 - 41908 (SEEDORCHARD)
NC07 - 42601 (BEAVER)
NC07 - 42603 (BALD MTN LOC)
NC07 - 42608 (HELL HOLE)
NC07 - 42611 (OWENS CAMP)
NC07 - 42615 (STEELY FORK)
NC08 - 40709 (LAUFMAN)
NC08 - 40714 (RAVENDALE)
NC08 - 40724 (DOYLE)
NC08 - 40725 (BLUE DOOR)
NC08 - 40727 (HORSE LAKE)
NC08 - 40728 (BULL FLAT)
NC08 - 41302 (DOG VALLEY)
NC08 - 41310 (STAMPEDE)
NC08 - 41311 (RICE CANYON)
NC08 - 260111 (BARREL SPRINGS)
NC08 - 260112 (JUNIPER SPRINGS)
NC08 - 260113 (BUFFALO CREEK)
Burning Index (BI) -- Choose a Station:
NC01 - 40102 (GASQUET 2)
NC01 - 40421 (EEL RIVER CAMP)
NC01 - 40425 (SCHOOLHOUSE)
NC01 - 40427 (NOTCHKO)
NC01 - 40428 (WESTSIDE)
NC01 - 40429 (KNEELAND)
NC02 - 41001 (BOONVILLE)
NC02 - 41005 (EEL RIVER (MNF))
NC02 - 41015 (RODEO VALLEY)
NC02 - 41018 (MENDOCINO PASS)
NC02 - 41101 (ALDER SPRINGS)
NC02 - 41402 (HIGH GLADE LOOKOUT)
NC02 - 41406 (SODA CREEK)
NC02 - 41411 (KONOCTI)
NC02 - 42010 (HAWKEYE)
NC02 - 42108 (ATLAS PEAK)
NC03A - 42308 (BARNABY)
NC03A - 42309 (WOODACRE)
NC03A - 42310 (BIG ROCK)
NC03A - 42312 (MIDDLE PEAK)
NC03A - 43009 (LAS TRAMPAS)
NC03A - 43304 (LA HONDA)
NC03A - 43309 (PULGAS)
NC03A - 43402 (OAKLAND NORTH)
NC03A - 43403 (OAKLAND SOUTH)
NC03A - 43802 (CORRALITOS)
NC03B - 43008 (BLACK DIAMOND)
NC03B - 43011 (MALLORY RIDGE)
NC03B - 43013 (LOS VAQUEROS)
NC03B - 43404 (ROSE PEAK)
NC03B - 43407 (ALTAMONT)
NC03B - 43502 (DIABLO GRANDE)
NC03B - 43809 (BEN LOMOND)
NC04 - 40101 (CAMP SIX)
NC04 - 40105 (SHIP MTN)
NC04 - 40203 (BLUE RIDGE (KNF))
NC04 - 40217 (MT. SHASTA)
NC04 - 40218 (OAK KNOLL)
NC04 - 40222 (SAWYERS BAR)
NC04 - 40225 (SLATER BUTTE)
NC04 - 40231 (SOMES BAR)
NC04 - 40237 (COLLINS BALDY)
NC04 - 40239 (QUARTZ HILL)
NC04 - 40244 (ASH CREEK)
NC04 - 40245 (CALLAHAN #2)
NC04 - 40246 (DUTCH-INDY)
NC04 - 40408 (HOOPA)
NC04 - 40501 (BIG BAR)
NC04 - 40503 (HAYFORK)
NC04 - 40507 (MAD RIVER)
NC04 - 40508 (RUTH)
NC04 - 40511 (YOLLA BOLLA)
NC04 - 40512 (FRIEND MTN.)
NC04 - 40516 (TRINITY CAMP)
NC04 - 40517 (SCORPION)
NC04 - 40518 (BACKBONE)
NC04 - 40519 (UNDERWOOD)
NC04 - 40520 (FIVE CENT)
NC04 - 40614 (SUGARLOAF (SHF))
NC04 - 40618 (SIMS)
NC05 - 40611 (REDDING)
NC05 - 40615 (WHITMORE)
NC05 - 40802 (EAGLE PEAK)
NC05 - 40812 (PATTYMOCUS)
NC05 - 40814 (CORNING)
NC05 - 40816 (THOMES CREEK)
NC05 - 41201 (BANGOR)
NC05 - 41211 (COHASSET)
NC05 - 41410 (COUNTY LINE)
NC05 - 41503 (STONYFORD)
NC05 - 41907 (LINCOLN)
NC05 - 42202 (BROOKS)
NC06 - 40221 (ROUND MOUNTAIN)
NC06 - 40228 (WEED AIRPORT)
NC06 - 40233 (INDIAN WELL)
NC06 - 40240 (JUANITA LAKE)
NC06 - 40242 (BRAZIE RANCH)
NC06 - 40243 (VAN BREMMER)
NC06 - 40247 (BOLAM)
NC06 - 40302 (BLUE MOUNTAIN)
NC06 - 40306 (TIMBER MOUNTAIN)
NC06 - 40308 (JUNIPER CREEK)
NC06 - 40309 (DEVILS GARDEN)
NC06 - 40312 (RUSH CREEK)
NC06 - 40313 (BEAR FLAT)
NC06 - 40314 (COLD SPRINGS)
NC06 - 40630 (SOLDIER MTN)
NC07 - 40609 (MANZANITA LAKE)
NC07 - 40635 (OAK MOUNTAIN)
NC07 - 40703 (BOGARD R.S.)
NC07 - 40719 (WESTWOOD)
NC07 - 40723 (LADDER BUTTE)
NC07 - 40730 (GORDON)
NC07 - 40801 (COLBY MOUNTAIN)
NC07 - 40904 (CHESTER)
NC07 - 40910 (QUINCY RD)
NC07 - 40915 (PIERCE)
NC07 - 40916 (CASHMAN)
NC07 - 40921 (DENTEN CREEK)
NC07 - 41213 (CARPENTER RIDGE)
NC07 - 41214 (JARBO GAP)
NC07 - 41304 (SADDLEBACK)
NC07 - 41701 (PIKE COUNTY LOOKOUT)
NC07 - 41806 (WHITE CLOUD)
NC07 - 41908 (SEEDORCHARD)
NC07 - 42601 (BEAVER)
NC07 - 42603 (BALD MTN LOC)
NC07 - 42608 (HELL HOLE)
NC07 - 42611 (OWENS CAMP)
NC07 - 42615 (STEELY FORK)
NC08 - 40709 (LAUFMAN)
NC08 - 40714 (RAVENDALE)
NC08 - 40724 (DOYLE)
NC08 - 40725 (BLUE DOOR)
NC08 - 40727 (HORSE LAKE)
NC08 - 40728 (BULL FLAT)
NC08 - 41302 (DOG VALLEY)
NC08 - 41310 (STAMPEDE)
NC08 - 41311 (RICE CANYON)
NC08 - 260111 (BARREL SPRINGS)
NC08 - 260112 (JUNIPER SPRINGS)
NC08 - 260113 (BUFFALO CREEK)
100 Hour Dead Fuel Moisture -- Choose a Station:
NC01 - 40102 (GASQUET 2)
NC01 - 40421 (EEL RIVER CAMP)
NC01 - 40425 (SCHOOLHOUSE)
NC01 - 40427 (NOTCHKO)
NC01 - 40428 (WESTSIDE)
NC01 - 40429 (KNEELAND)
NC02 - 41001 (BOONVILLE)
NC02 - 41005 (EEL RIVER (MNF))
NC02 - 41015 (RODEO VALLEY)
NC02 - 41018 (MENDOCINO PASS)
NC02 - 41101 (ALDER SPRINGS)
NC02 - 41402 (HIGH GLADE LOOKOUT)
NC02 - 41406 (SODA CREEK)
NC02 - 41411 (KONOCTI)
NC02 - 42010 (HAWKEYE)
NC02 - 42108 (ATLAS PEAK)
NC03A - 42308 (BARNABY)
NC03A - 42309 (WOODACRE)
NC03A - 42310 (BIG ROCK)
NC03A - 42312 (MIDDLE PEAK)
NC03A - 43009 (LAS TRAMPAS)
NC03A - 43304 (LA HONDA)
NC03A - 43309 (PULGAS)
NC03A - 43402 (OAKLAND NORTH)
NC03A - 43403 (OAKLAND SOUTH)
NC03A - 43802 (CORRALITOS)
NC03B - 43008 (BLACK DIAMOND)
NC03B - 43011 (MALLORY RIDGE)
NC03B - 43013 (LOS VAQUEROS)
NC03B - 43404 (ROSE PEAK)
NC03B - 43407 (ALTAMONT)
NC03B - 43502 (DIABLO GRANDE)
NC03B - 43809 (BEN LOMOND)
NC04 - 40101 (CAMP SIX)
NC04 - 40105 (SHIP MTN)
NC04 - 40203 (BLUE RIDGE (KNF))
NC04 - 40217 (MT. SHASTA)
NC04 - 40218 (OAK KNOLL)
NC04 - 40222 (SAWYERS BAR)
NC04 - 40225 (SLATER BUTTE)
NC04 - 40231 (SOMES BAR)
NC04 - 40237 (COLLINS BALDY)
NC04 - 40239 (QUARTZ HILL)
NC04 - 40244 (ASH CREEK)
NC04 - 40245 (CALLAHAN #2)
NC04 - 40246 (DUTCH-INDY)
NC04 - 40408 (HOOPA)
NC04 - 40501 (BIG BAR)
NC04 - 40503 (HAYFORK)
NC04 - 40507 (MAD RIVER)
NC04 - 40508 (RUTH)
NC04 - 40511 (YOLLA BOLLA)
NC04 - 40512 (FRIEND MTN.)
NC04 - 40516 (TRINITY CAMP)
NC04 - 40517 (SCORPION)
NC04 - 40518 (BACKBONE)
NC04 - 40519 (UNDERWOOD)
NC04 - 40520 (FIVE CENT)
NC04 - 40614 (SUGARLOAF (SHF))
NC04 - 40618 (SIMS)
NC05 - 40611 (REDDING)
NC05 - 40615 (WHITMORE)
NC05 - 40802 (EAGLE PEAK)
NC05 - 40812 (PATTYMOCUS)
NC05 - 40814 (CORNING)
NC05 - 40816 (THOMES CREEK)
NC05 - 41201 (BANGOR)
NC05 - 41211 (COHASSET)
NC05 - 41410 (COUNTY LINE)
NC05 - 41503 (STONYFORD)
NC05 - 41907 (LINCOLN)
NC05 - 42202 (BROOKS)
NC06 - 40221 (ROUND MOUNTAIN)
NC06 - 40228 (WEED AIRPORT)
NC06 - 40233 (INDIAN WELL)
NC06 - 40240 (JUANITA LAKE)
NC06 - 40242 (BRAZIE RANCH)
NC06 - 40243 (VAN BREMMER)
NC06 - 40247 (BOLAM)
NC06 - 40302 (BLUE MOUNTAIN)
NC06 - 40306 (TIMBER MOUNTAIN)
NC06 - 40308 (JUNIPER CREEK)
NC06 - 40309 (DEVILS GARDEN)
NC06 - 40312 (RUSH CREEK)
NC06 - 40313 (BEAR FLAT)
NC06 - 40314 (COLD SPRINGS)
NC06 - 40630 (SOLDIER MTN)
NC07 - 40609 (MANZANITA LAKE)
NC07 - 40635 (OAK MOUNTAIN)
NC07 - 40703 (BOGARD R.S.)
NC07 - 40719 (WESTWOOD)
NC07 - 40723 (LADDER BUTTE)
NC07 - 40730 (GORDON)
NC07 - 40801 (COLBY MOUNTAIN)
NC07 - 40904 (CHESTER)
NC07 - 40910 (QUINCY RD)
NC07 - 40915 (PIERCE)
NC07 - 40916 (CASHMAN)
NC07 - 40921 (DENTEN CREEK)
NC07 - 41213 (CARPENTER RIDGE)
NC07 - 41214 (JARBO GAP)
NC07 - 41304 (SADDLEBACK)
NC07 - 41701 (PIKE COUNTY LOOKOUT)
NC07 - 41806 (WHITE CLOUD)
NC07 - 41908 (SEEDORCHARD)
NC07 - 42601 (BEAVER)
NC07 - 42603 (BALD MTN LOC)
NC07 - 42608 (HELL HOLE)
NC07 - 42611 (OWENS CAMP)
NC07 - 42615 (STEELY FORK)
NC08 - 40709 (LAUFMAN)
NC08 - 40714 (RAVENDALE)
NC08 - 40724 (DOYLE)
NC08 - 40725 (BLUE DOOR)
NC08 - 40727 (HORSE LAKE)
NC08 - 40728 (BULL FLAT)
NC08 - 41302 (DOG VALLEY)
NC08 - 41310 (STAMPEDE)
NC08 - 41311 (RICE CANYON)
NC08 - 260111 (BARREL SPRINGS)
NC08 - 260112 (JUNIPER SPRINGS)
NC08 - 260113 (BUFFALO CREEK)
1,000 Hour Dead Fuel Moisture -- Choose a Station:
NC01 - 40102 (GASQUET 2)
NC01 - 40421 (EEL RIVER CAMP)
NC01 - 40425 (SCHOOLHOUSE)
NC01 - 40427 (NOTCHKO)
NC01 - 40428 (WESTSIDE)
NC01 - 40429 (KNEELAND)
NC02 - 41001 (BOONVILLE)
NC02 - 41005 (EEL RIVER (MNF))
NC02 - 41015 (RODEO VALLEY)
NC02 - 41018 (MENDOCINO PASS)
NC02 - 41101 (ALDER SPRINGS)
NC02 - 41402 (HIGH GLADE LOOKOUT)
NC02 - 41406 (SODA CREEK)
NC02 - 41411 (KONOCTI)
NC02 - 42010 (HAWKEYE)
NC02 - 42108 (ATLAS PEAK)
NC03A - 42308 (BARNABY)
NC03A - 42309 (WOODACRE)
NC03A - 42310 (BIG ROCK)
NC03A - 42312 (MIDDLE PEAK)
NC03A - 43009 (LAS TRAMPAS)
NC03A - 43304 (LA HONDA)
NC03A - 43309 (PULGAS)
NC03A - 43402 (OAKLAND NORTH)
NC03A - 43403 (OAKLAND SOUTH)
NC03A - 43802 (CORRALITOS)
NC03B - 43008 (BLACK DIAMOND)
NC03B - 43011 (MALLORY RIDGE)
NC03B - 43013 (LOS VAQUEROS)
NC03B - 43404 (ROSE PEAK)
NC03B - 43407 (ALTAMONT)
NC03B - 43502 (DIABLO GRANDE)
NC03B - 43809 (BEN LOMOND)
NC04 - 40101 (CAMP SIX)
NC04 - 40105 (SHIP MTN)
NC04 - 40203 (BLUE RIDGE (KNF))
NC04 - 40217 (MT. SHASTA)
NC04 - 40218 (OAK KNOLL)
NC04 - 40222 (SAWYERS BAR)
NC04 - 40225 (SLATER BUTTE)
NC04 - 40231 (SOMES BAR)
NC04 - 40237 (COLLINS BALDY)
NC04 - 40239 (QUARTZ HILL)
NC04 - 40244 (ASH CREEK)
NC04 - 40245 (CALLAHAN #2)
NC04 - 40246 (DUTCH-INDY)
NC04 - 40408 (HOOPA)
NC04 - 40501 (BIG BAR)
NC04 - 40503 (HAYFORK)
NC04 - 40507 (MAD RIVER)
NC04 - 40508 (RUTH)
NC04 - 40511 (YOLLA BOLLA)
NC04 - 40512 (FRIEND MTN.)
NC04 - 40516 (TRINITY CAMP)
NC04 - 40517 (SCORPION)
NC04 - 40518 (BACKBONE)
NC04 - 40519 (UNDERWOOD)
NC04 - 40520 (FIVE CENT)
NC04 - 40614 (SUGARLOAF (SHF))
NC04 - 40618 (SIMS)
NC05 - 40611 (REDDING)
NC05 - 40615 (WHITMORE)
NC05 - 40802 (EAGLE PEAK)
NC05 - 40812 (PATTYMOCUS)
NC05 - 40814 (CORNING)
NC05 - 40816 (THOMES CREEK)
NC05 - 41201 (BANGOR)
NC05 - 41211 (COHASSET)
NC05 - 41410 (COUNTY LINE)
NC05 - 41503 (STONYFORD)
NC05 - 41907 (LINCOLN)
NC05 - 42202 (BROOKS)
NC06 - 40221 (ROUND MOUNTAIN)
NC06 - 40228 (WEED AIRPORT)
NC06 - 40233 (INDIAN WELL)
NC06 - 40240 (JUANITA LAKE)
NC06 - 40242 (BRAZIE RANCH)
NC06 - 40243 (VAN BREMMER)
NC06 - 40247 (BOLAM)
NC06 - 40302 (BLUE MOUNTAIN)
NC06 - 40306 (TIMBER MOUNTAIN)
NC06 - 40308 (JUNIPER CREEK)
NC06 - 40309 (DEVILS GARDEN)
NC06 - 40312 (RUSH CREEK)
NC06 - 40313 (BEAR FLAT)
NC06 - 40314 (COLD SPRINGS)
NC06 - 40630 (SOLDIER MTN)
NC07 - 40609 (MANZANITA LAKE)
NC07 - 40635 (OAK MOUNTAIN)
NC07 - 40703 (BOGARD R.S.)
NC07 - 40719 (WESTWOOD)
NC07 - 40723 (LADDER BUTTE)
NC07 - 40730 (GORDON)
NC07 - 40801 (COLBY MOUNTAIN)
NC07 - 40904 (CHESTER)
NC07 - 40910 (QUINCY RD)
NC07 - 40915 (PIERCE)
NC07 - 40916 (CASHMAN)
NC07 - 40921 (DENTEN CREEK)
NC07 - 41213 (CARPENTER RIDGE)
NC07 - 41214 (JARBO GAP)
NC07 - 41304 (SADDLEBACK)
NC07 - 41701 (PIKE COUNTY LOOKOUT)
NC07 - 41806 (WHITE CLOUD)
NC07 - 41908 (SEEDORCHARD)
NC07 - 42601 (BEAVER)
NC07 - 42603 (BALD MTN LOC)
NC07 - 42608 (HELL HOLE)
NC07 - 42611 (OWENS CAMP)
NC07 - 42615 (STEELY FORK)
NC08 - 40709 (LAUFMAN)
NC08 - 40714 (RAVENDALE)
NC08 - 40724 (DOYLE)
NC08 - 40725 (BLUE DOOR)
NC08 - 40727 (HORSE LAKE)
NC08 - 40728 (BULL FLAT)
NC08 - 41302 (DOG VALLEY)
NC08 - 41310 (STAMPEDE)
NC08 - 41311 (RICE CANYON)
NC08 - 260111 (BARREL SPRINGS)
NC08 - 260112 (JUNIPER SPRINGS)
NC08 - 260113 (BUFFALO CREEK)
Fuels and Fire Danger Information
Vegetation Greeness & Normalized Difference Vegetation Index (NDVI)
USGS NDVI Information
USGS Fire Danger Viewer - Including NDVI Maps
Drought.gov NDVI Information
NOAA NDVI Mapper
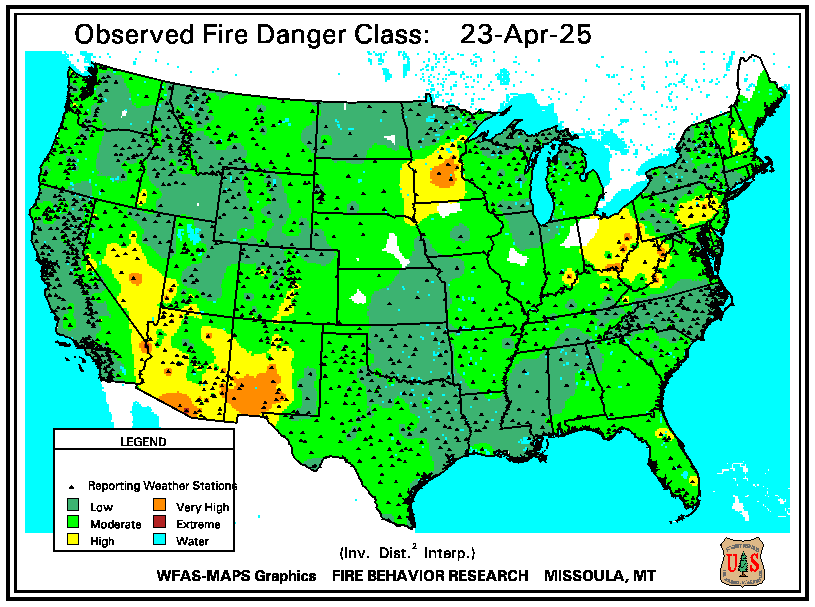
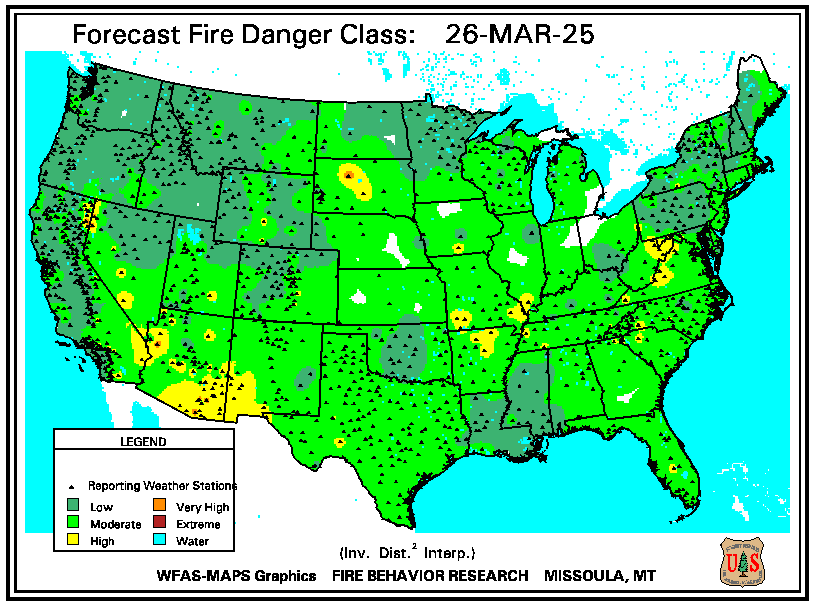
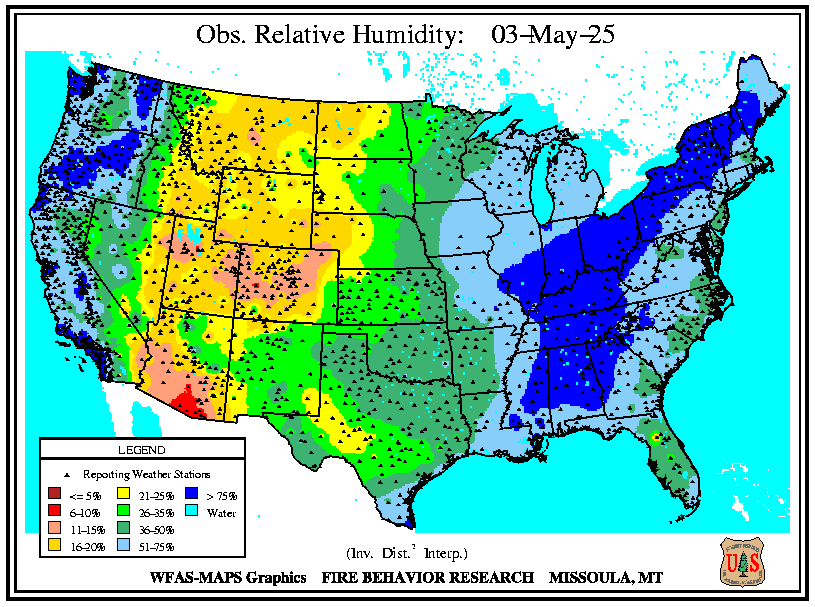
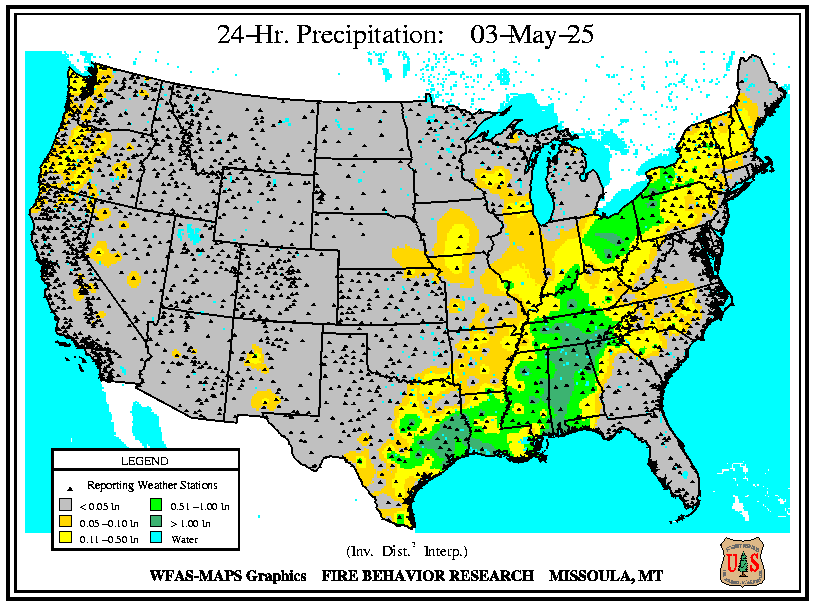
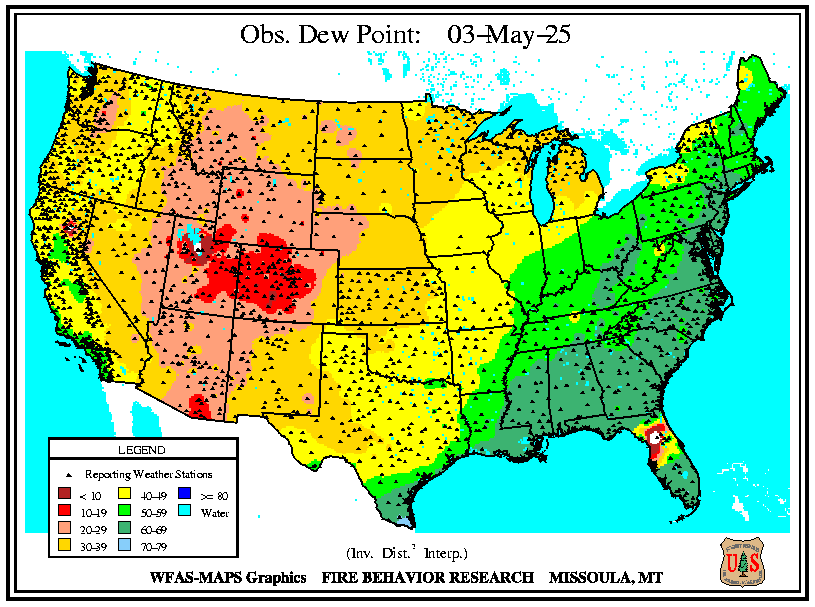
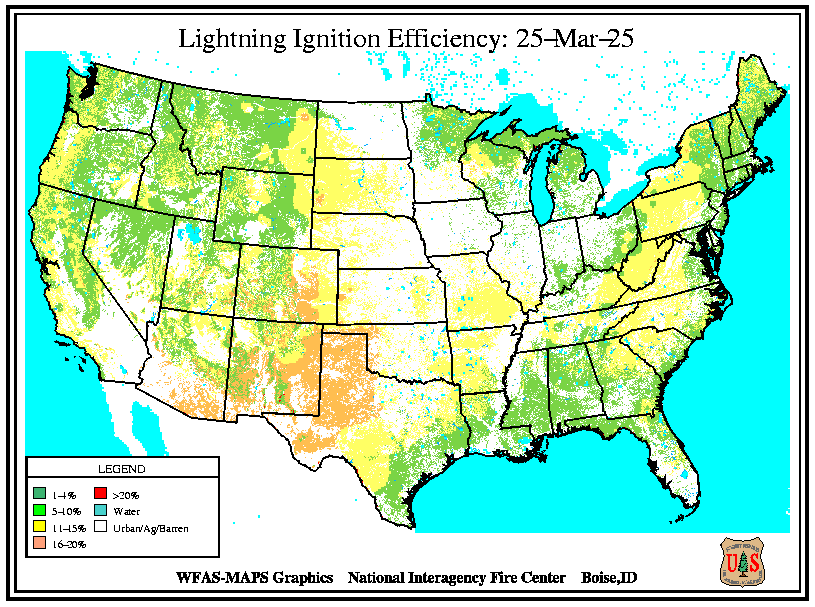
Wildland Fire Assessment System (WFAS)
WFAS Main Page
Observed Fire Danger
Forecast Fire Danger
Relative Humidity
24-Hour Rainfall Totals
Dew Point Levels
Lightning Ignition Efficiency
Dry Lightning Maps
Fuels, Fire & Smoke Management
Current Fuels and Fire Behavior Advisories
Regional Fuels, Fire Ecology & Smoke Management
Fuel Moisture
FEMS -Replacement for National Fuel Moisture Database (Log in required)
Fuel Moisture Definitions
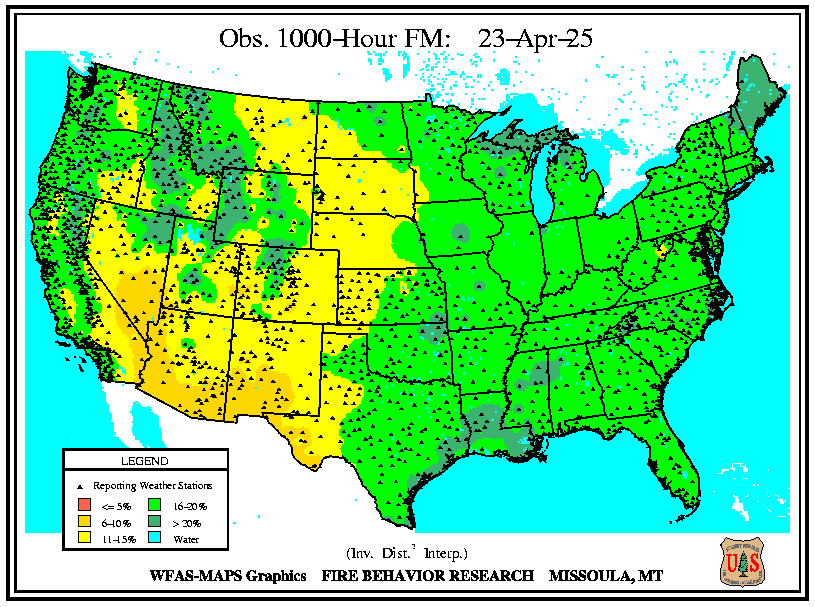
1000-Hour FM
(WFAS)
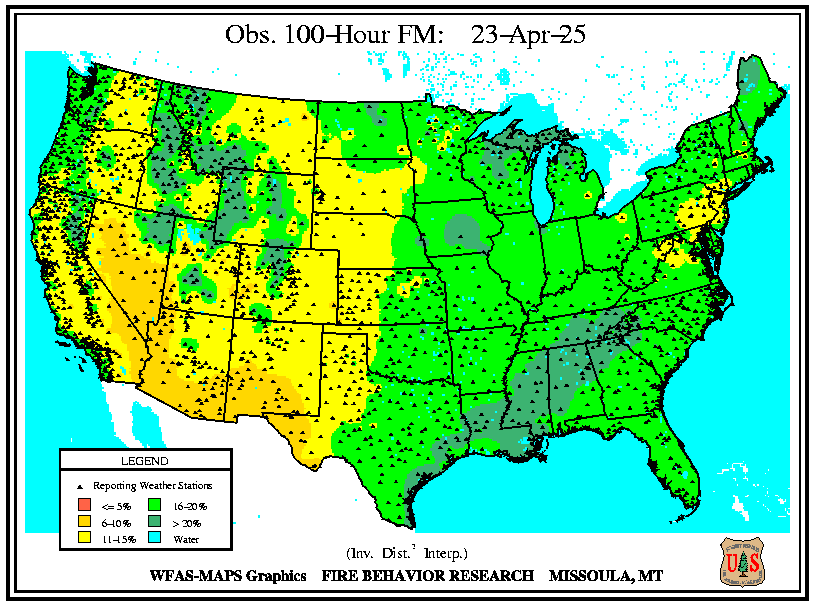
100-Hour FM
(WFAS)
California Hourly Fire Danger
DRI/CEFA
NASA SPoRT LIS Soil Moisture Map Viewer
Pocket Cards
Local Area & National
