This chart was last updated on: Tuesday, September 21, 2021 at 09:37 AM.


| KBDI and Related Moisture Maps | |||||
|
|
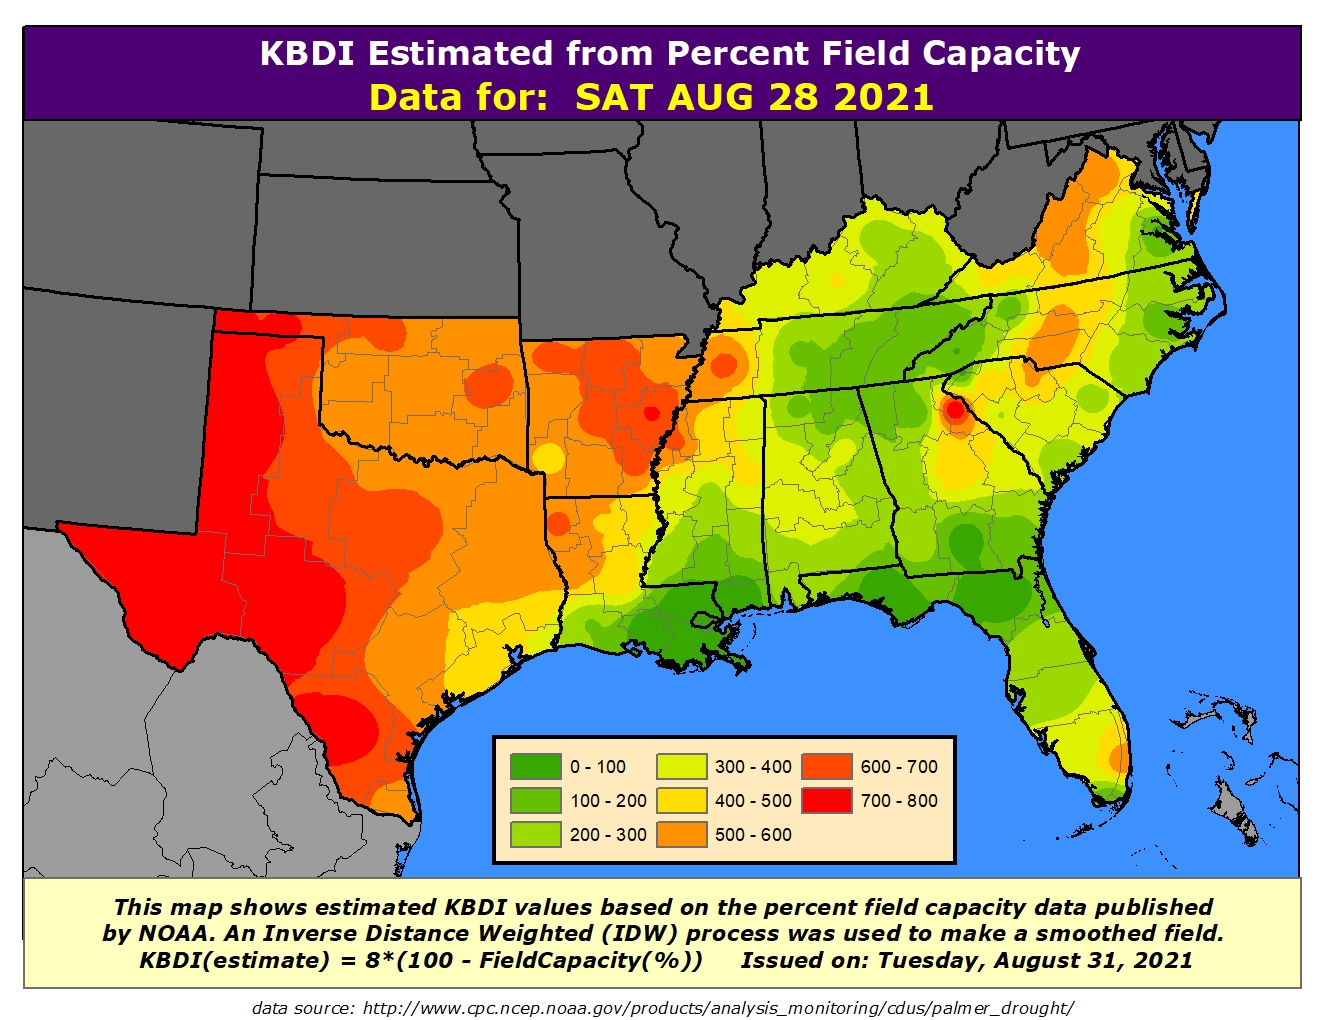
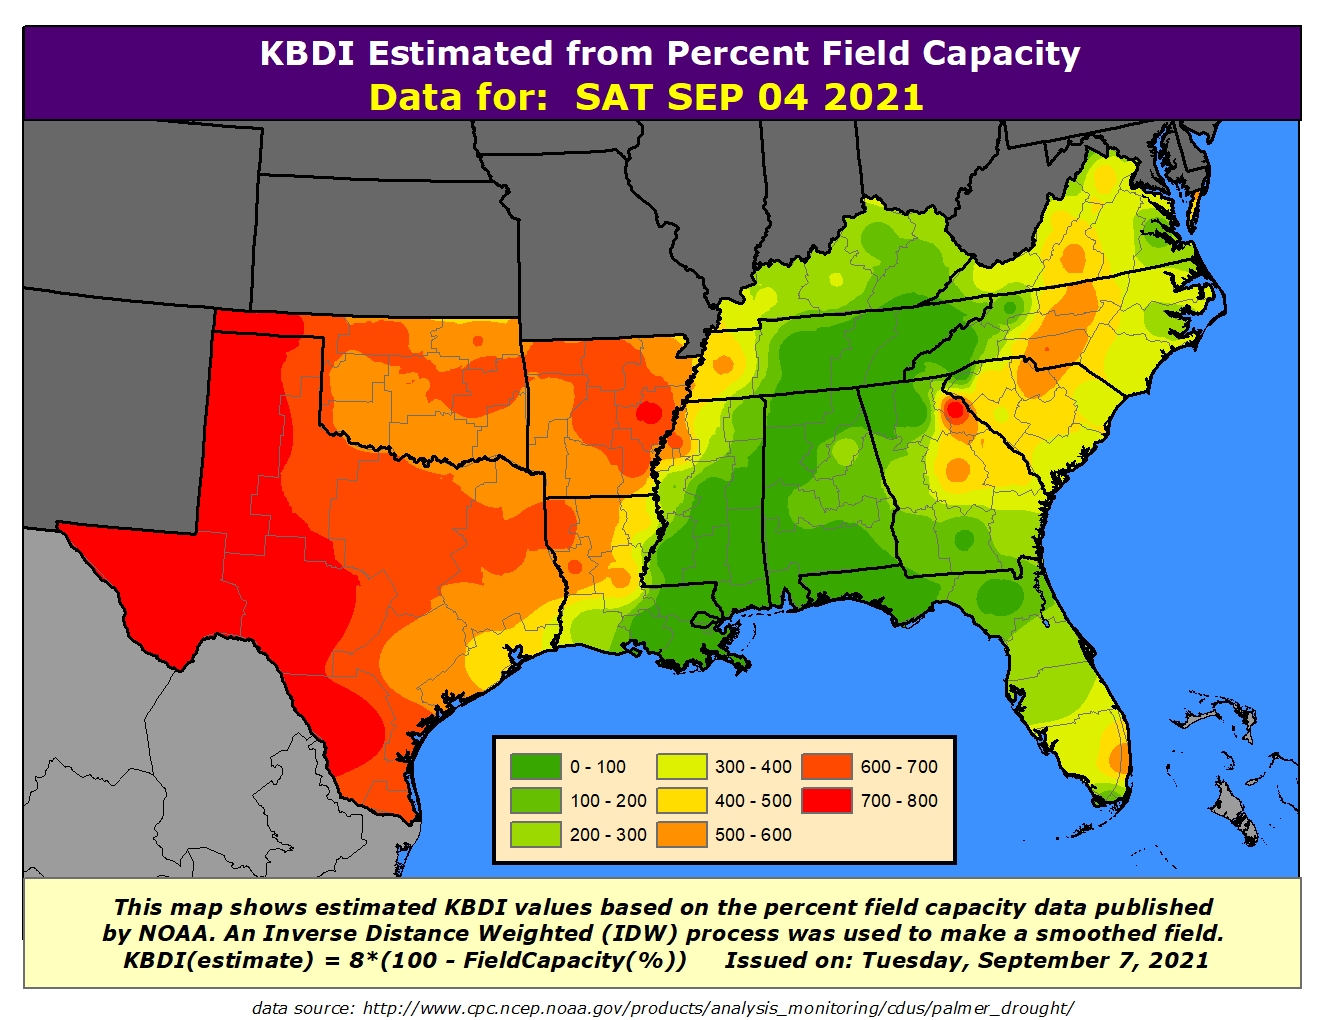
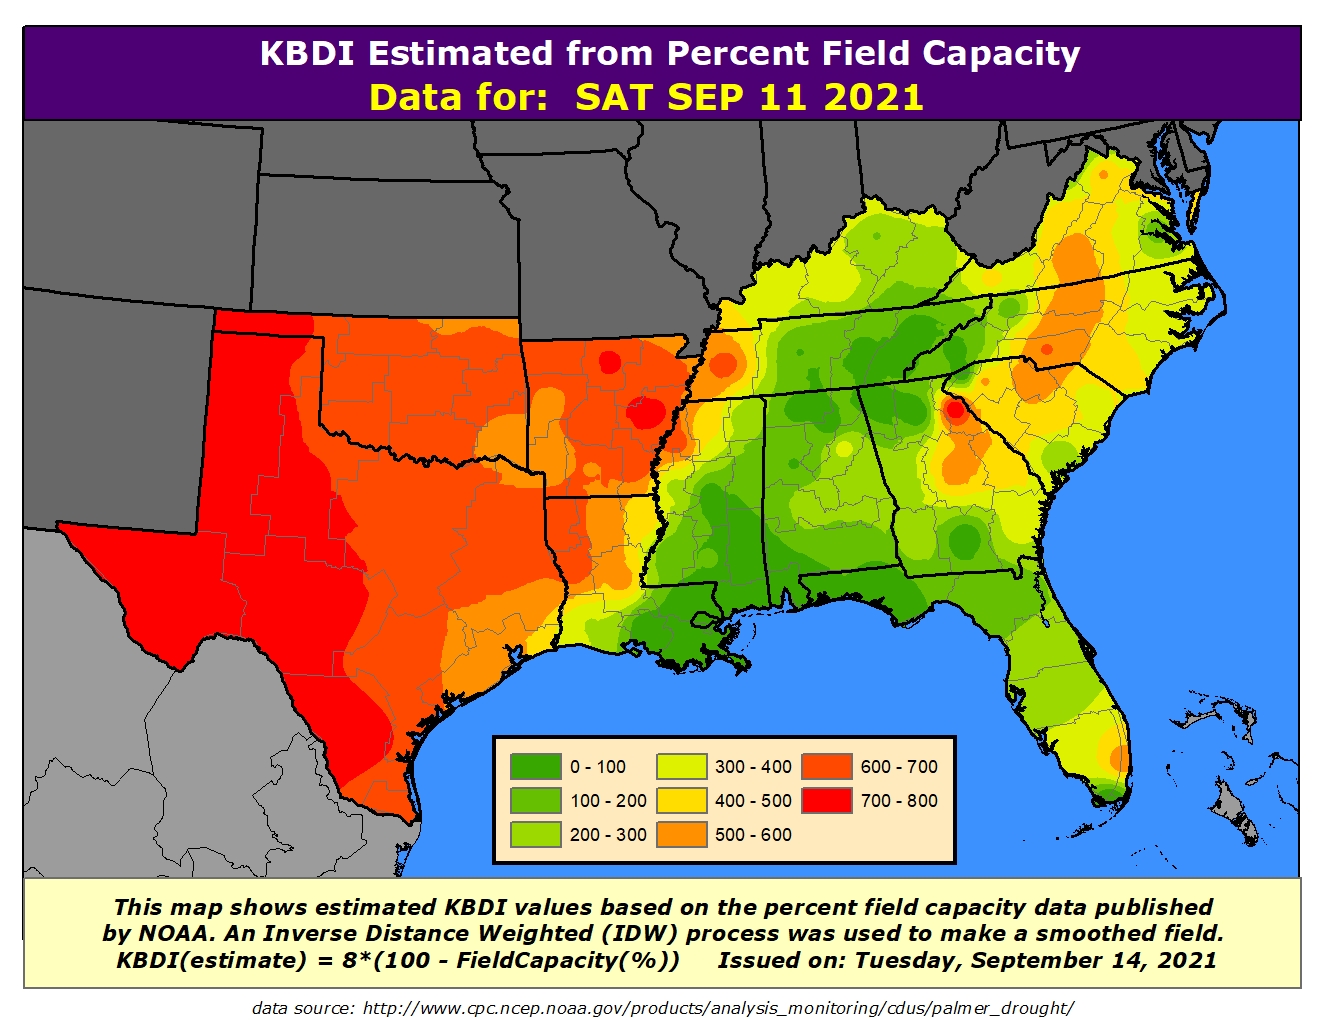
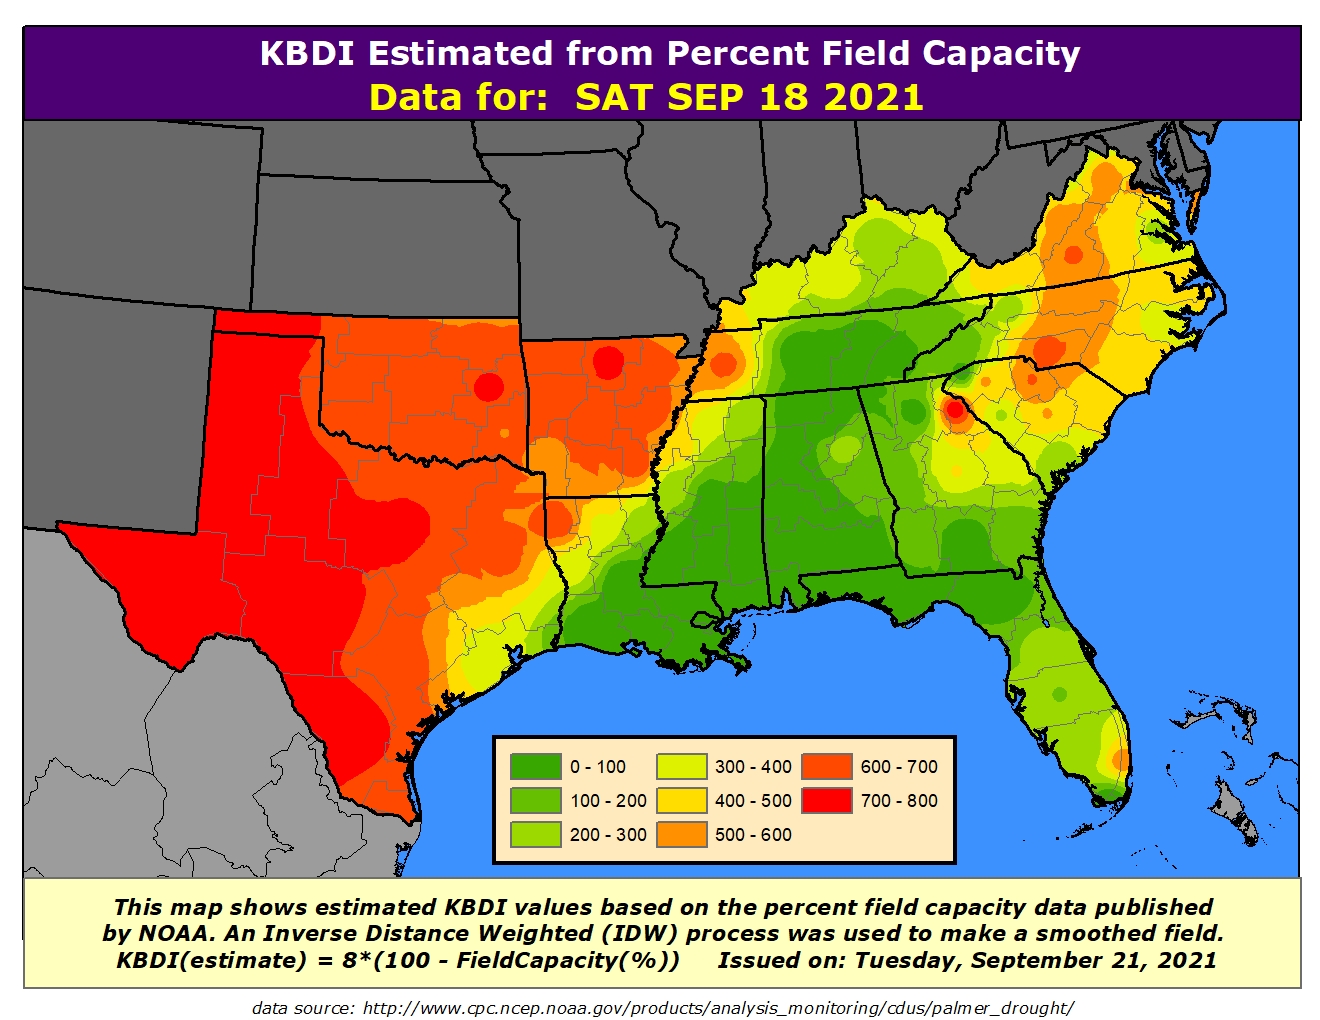
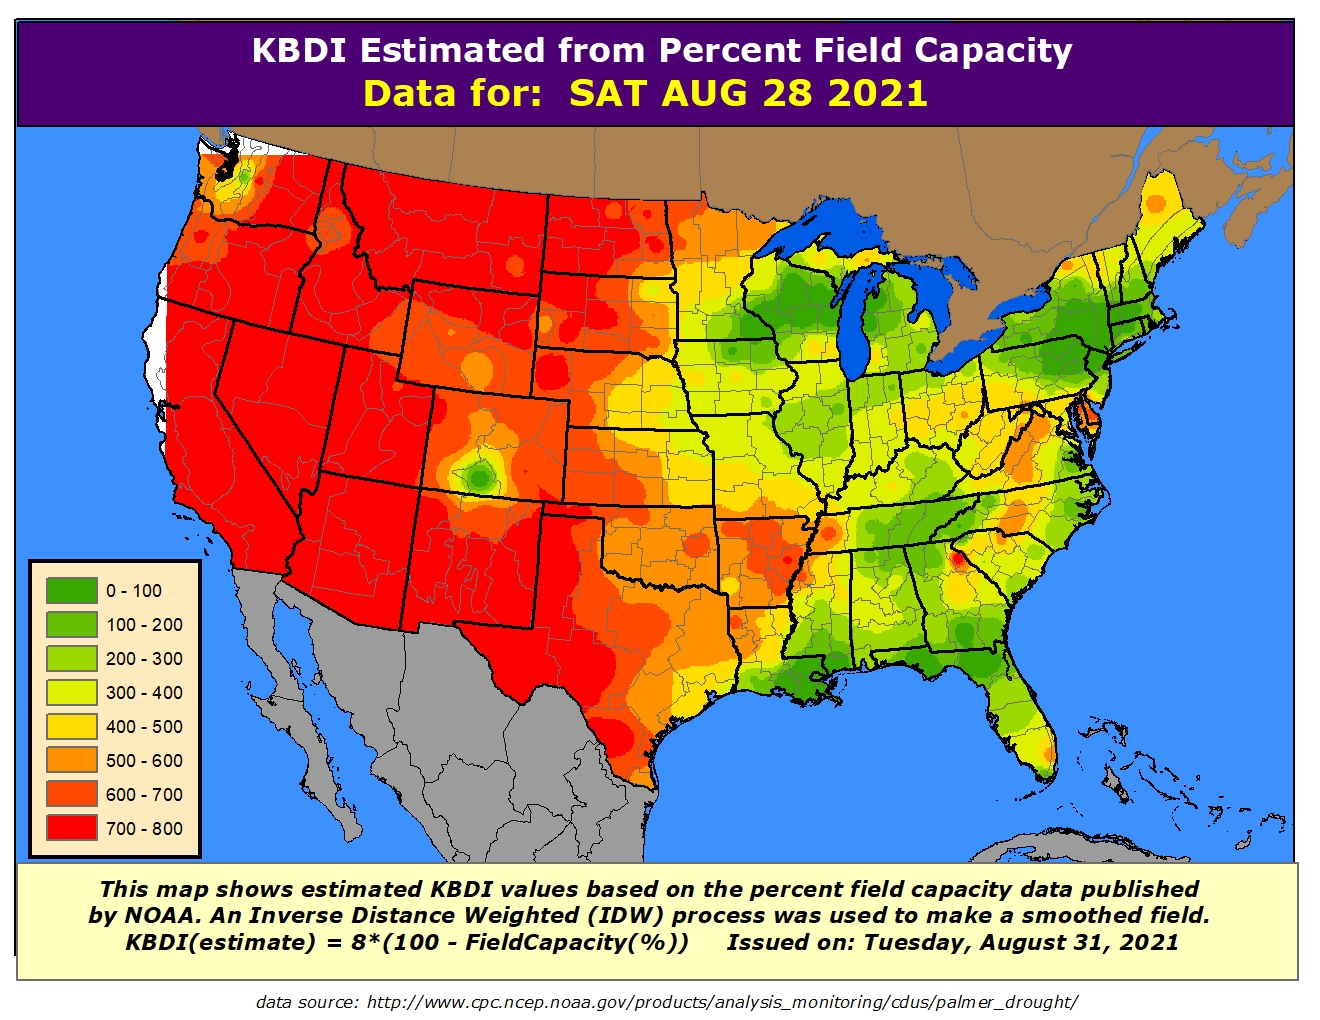
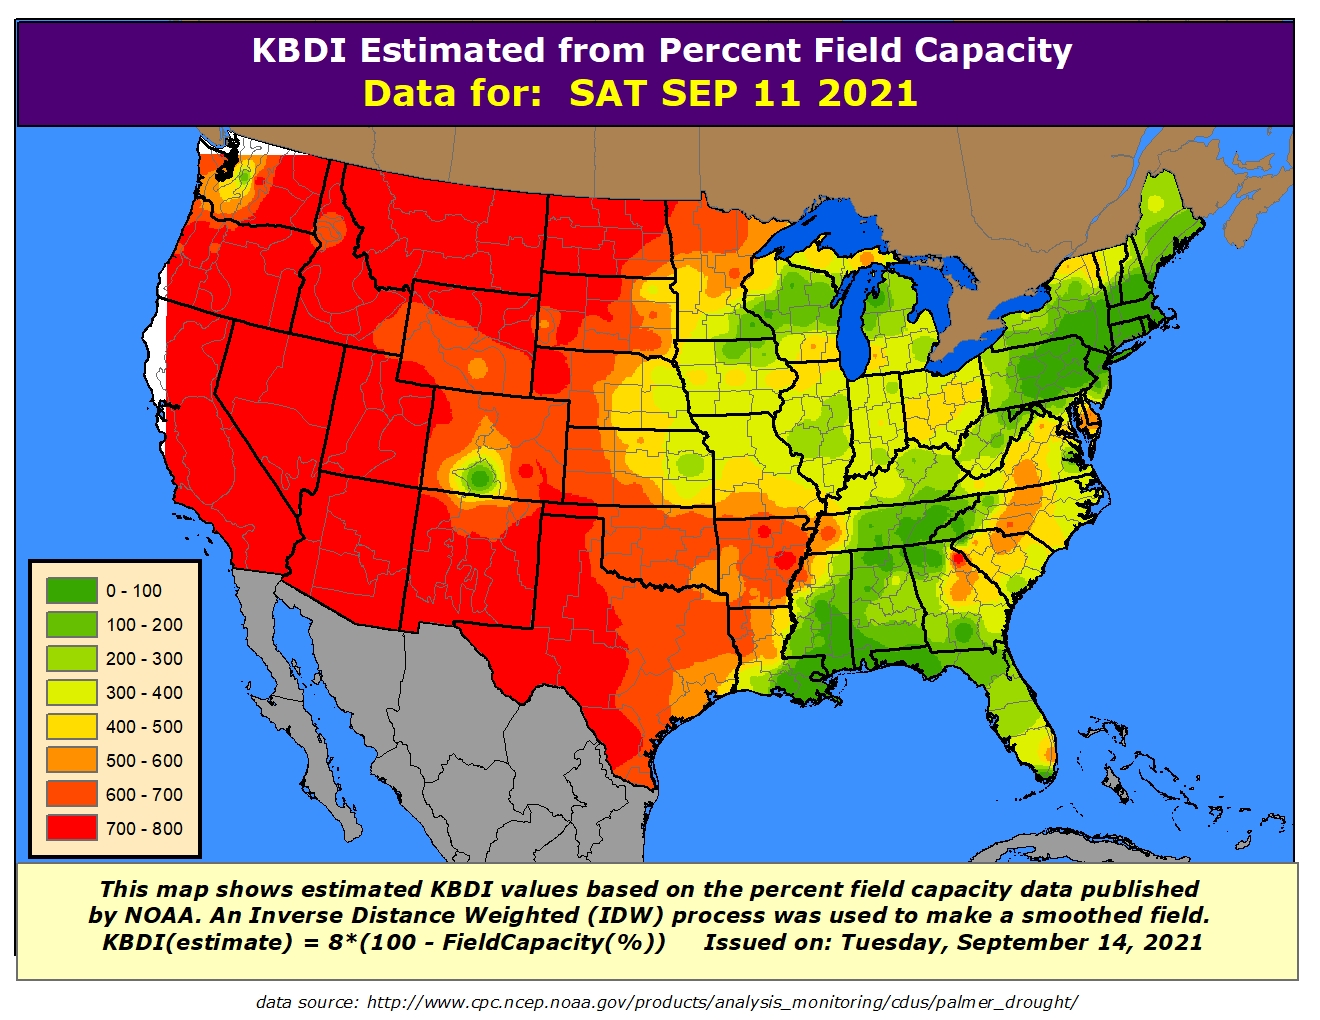
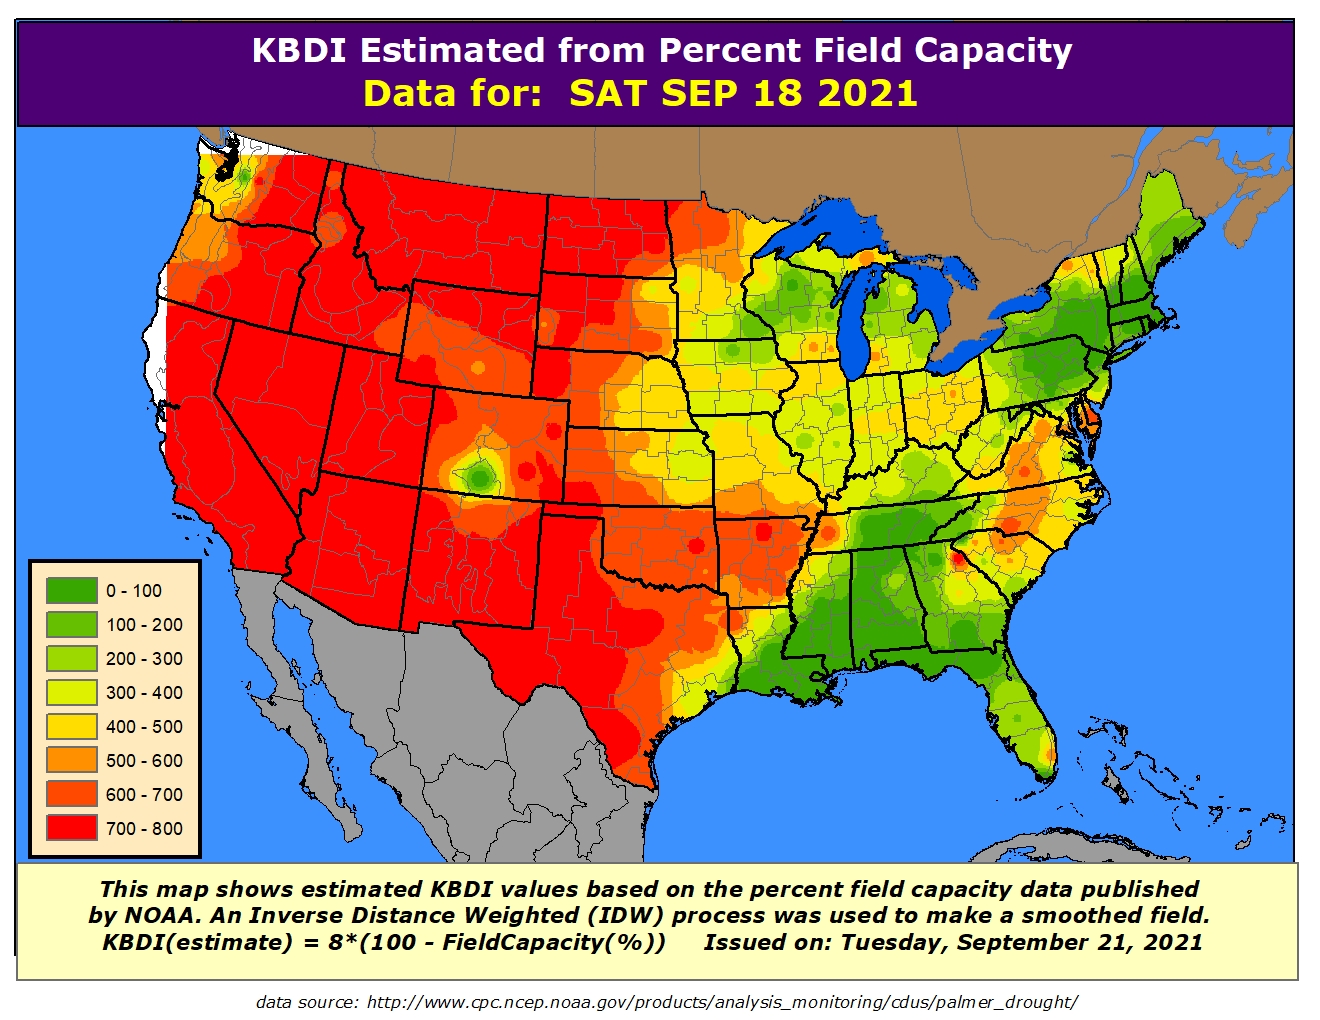
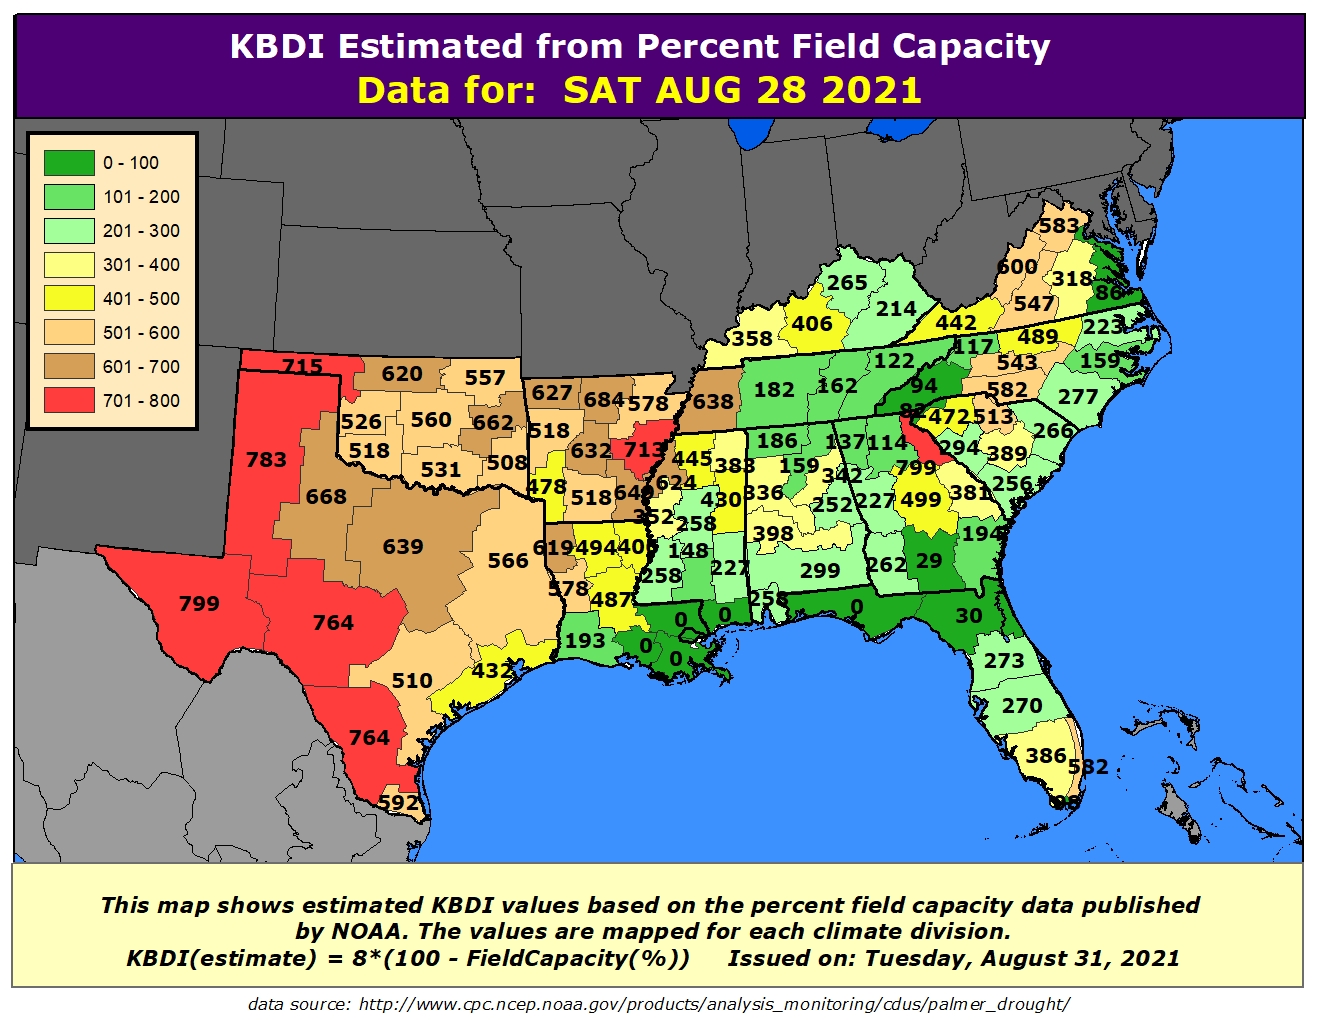
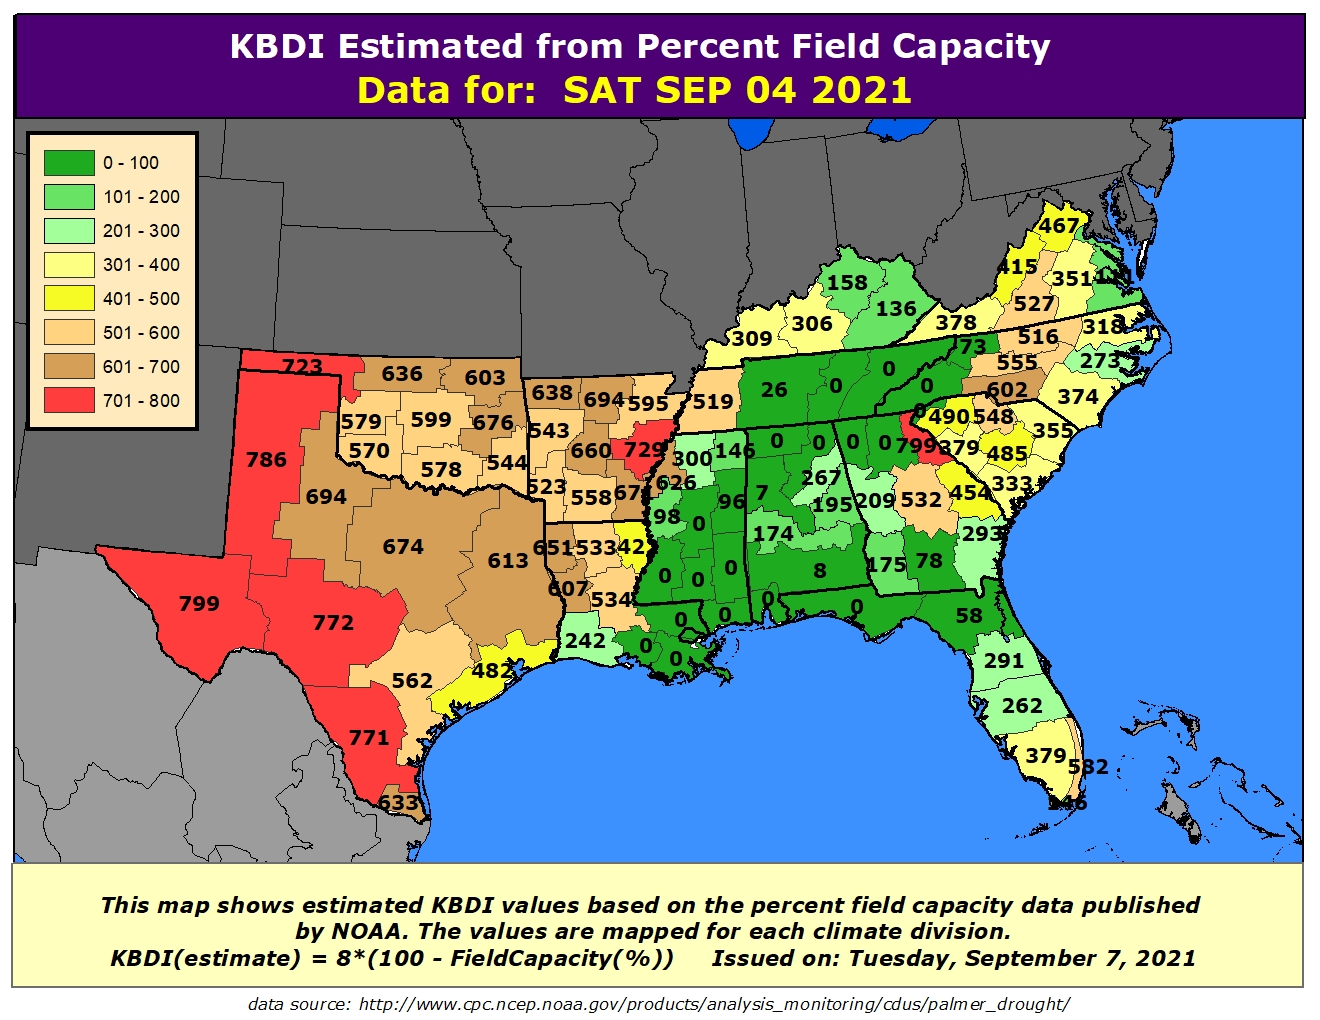
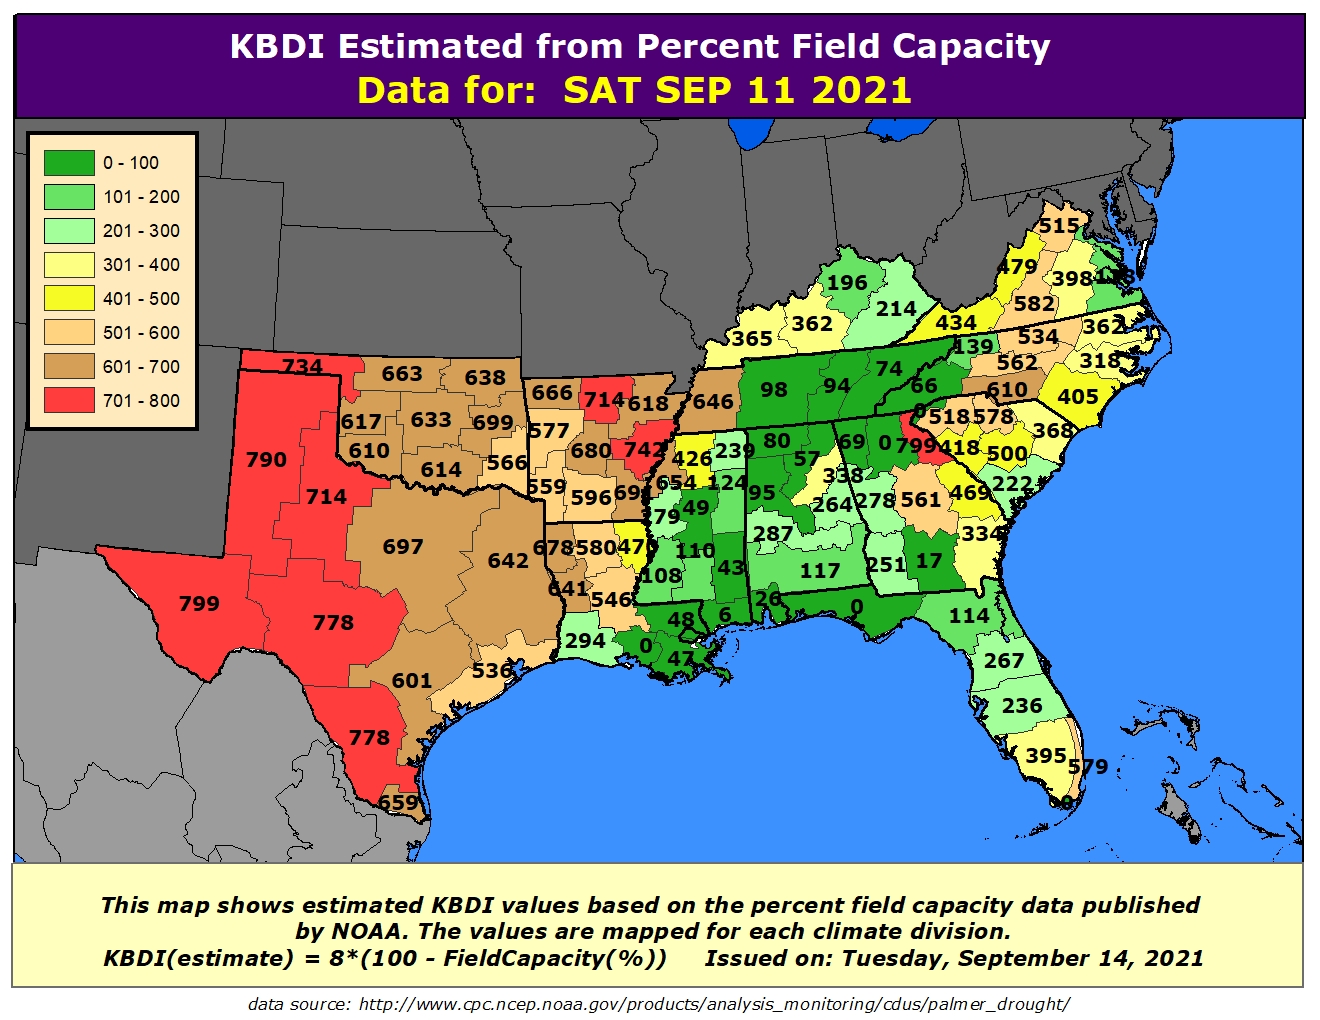
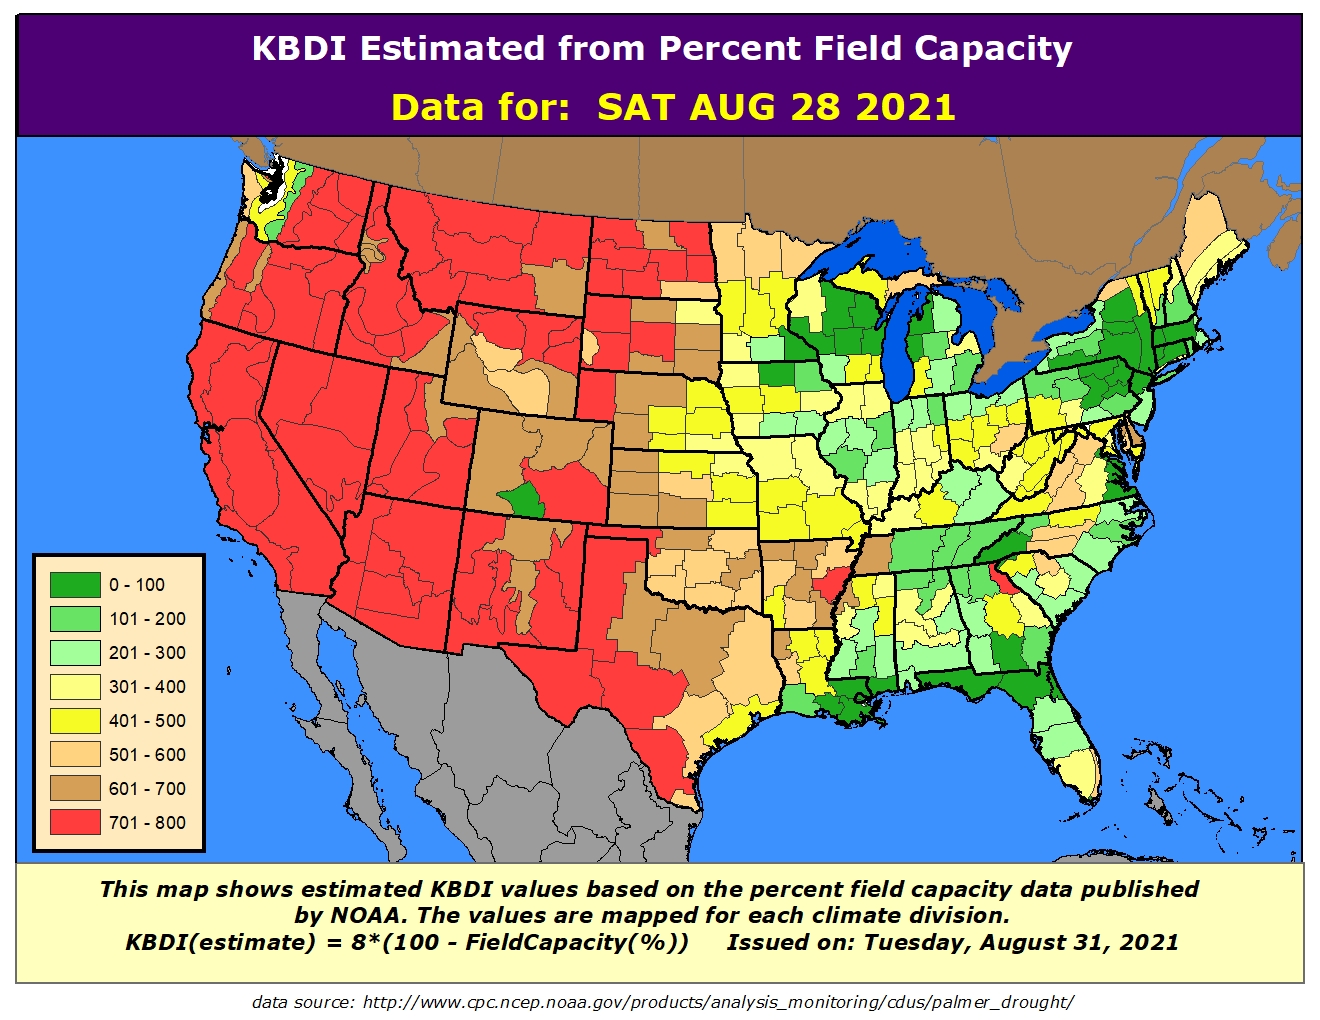
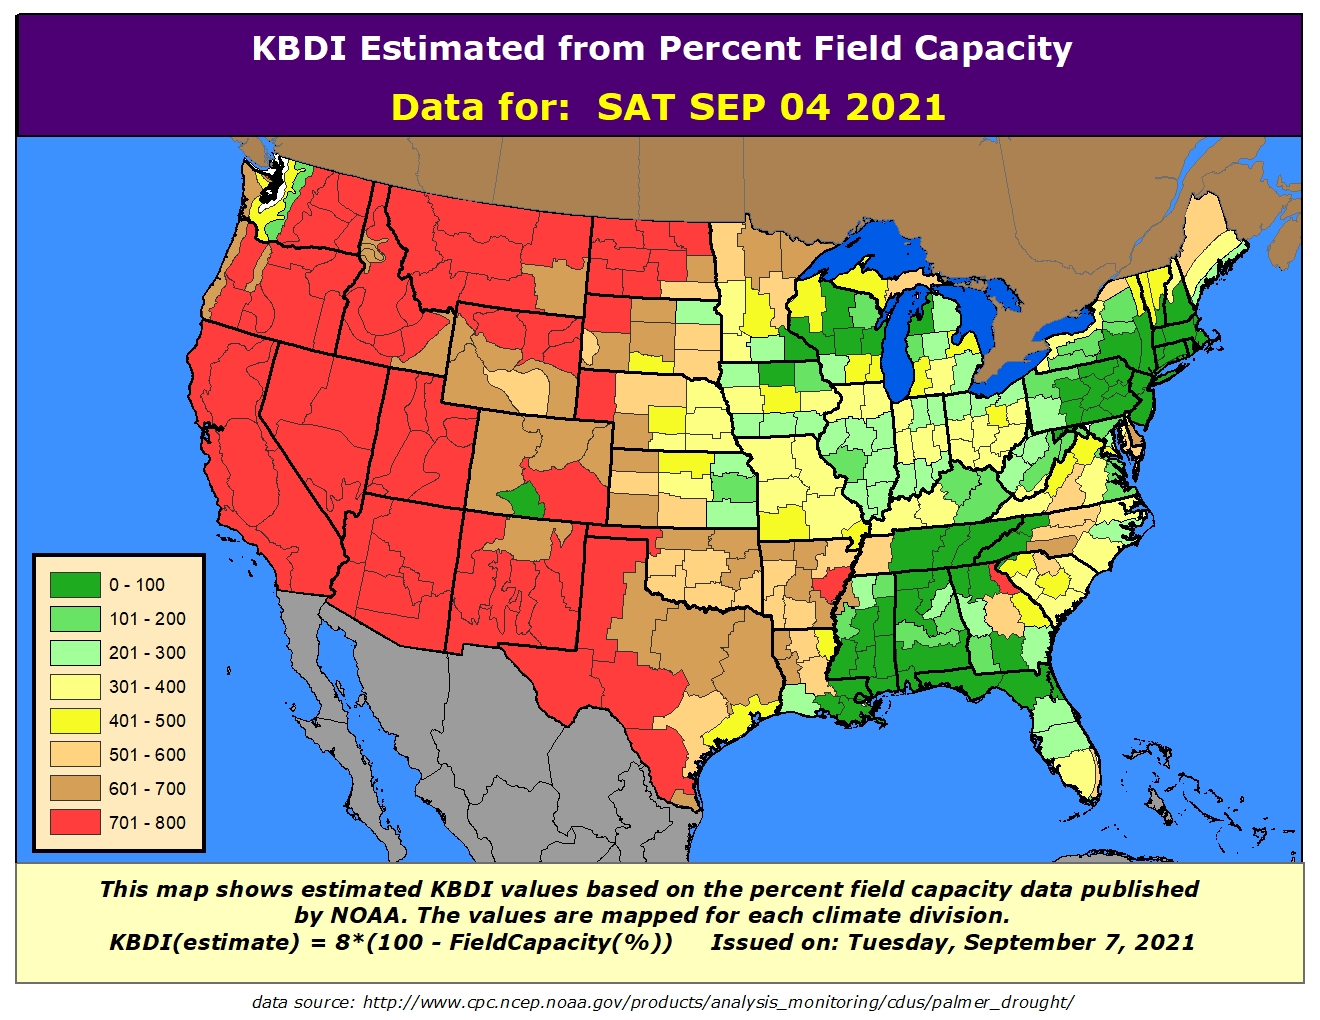
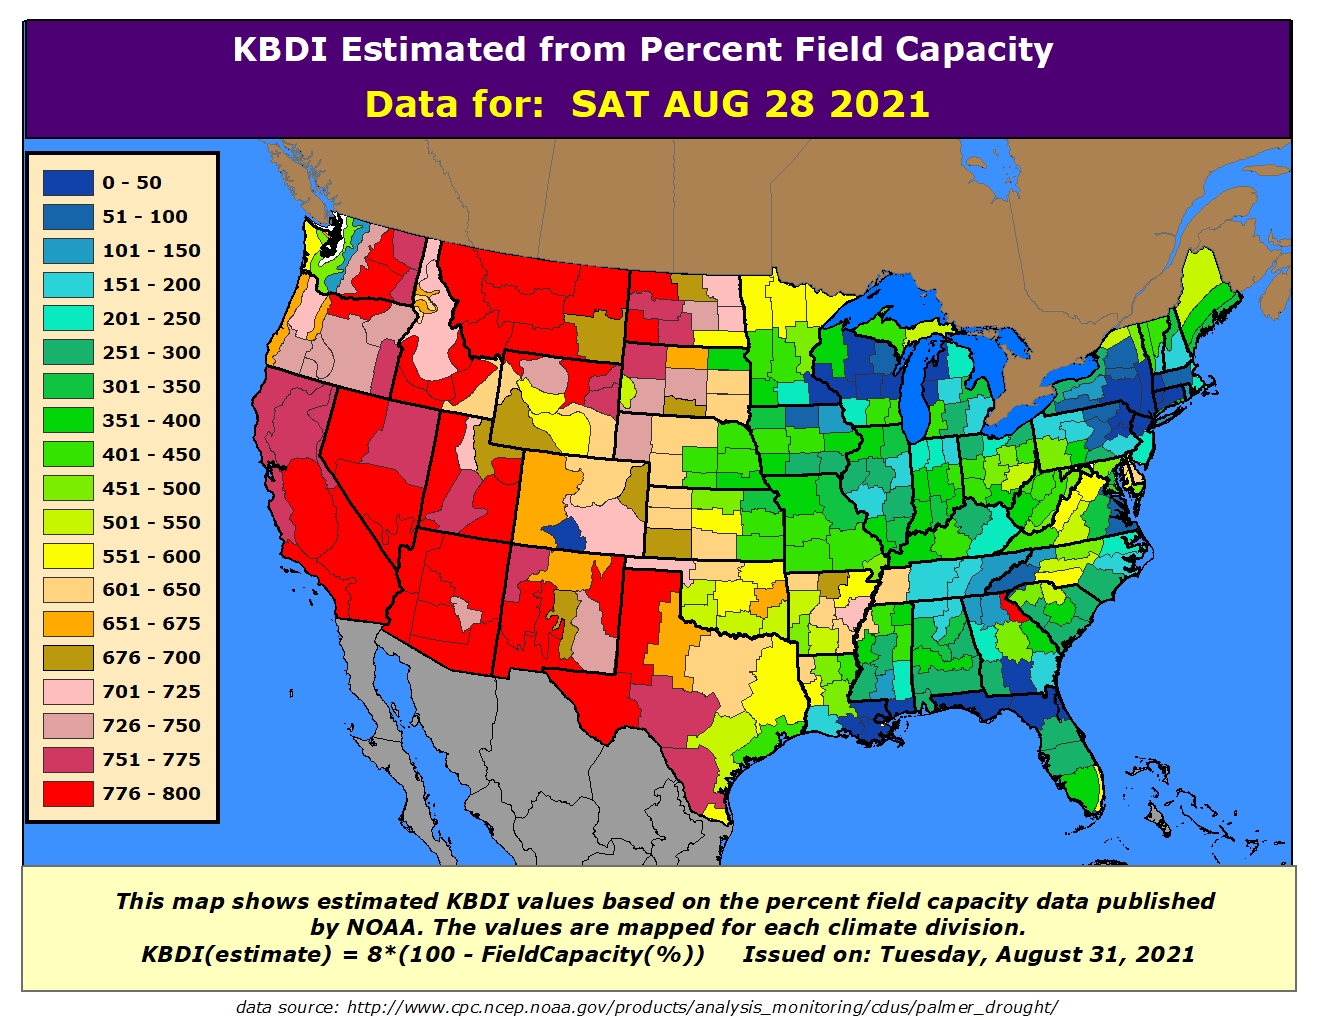
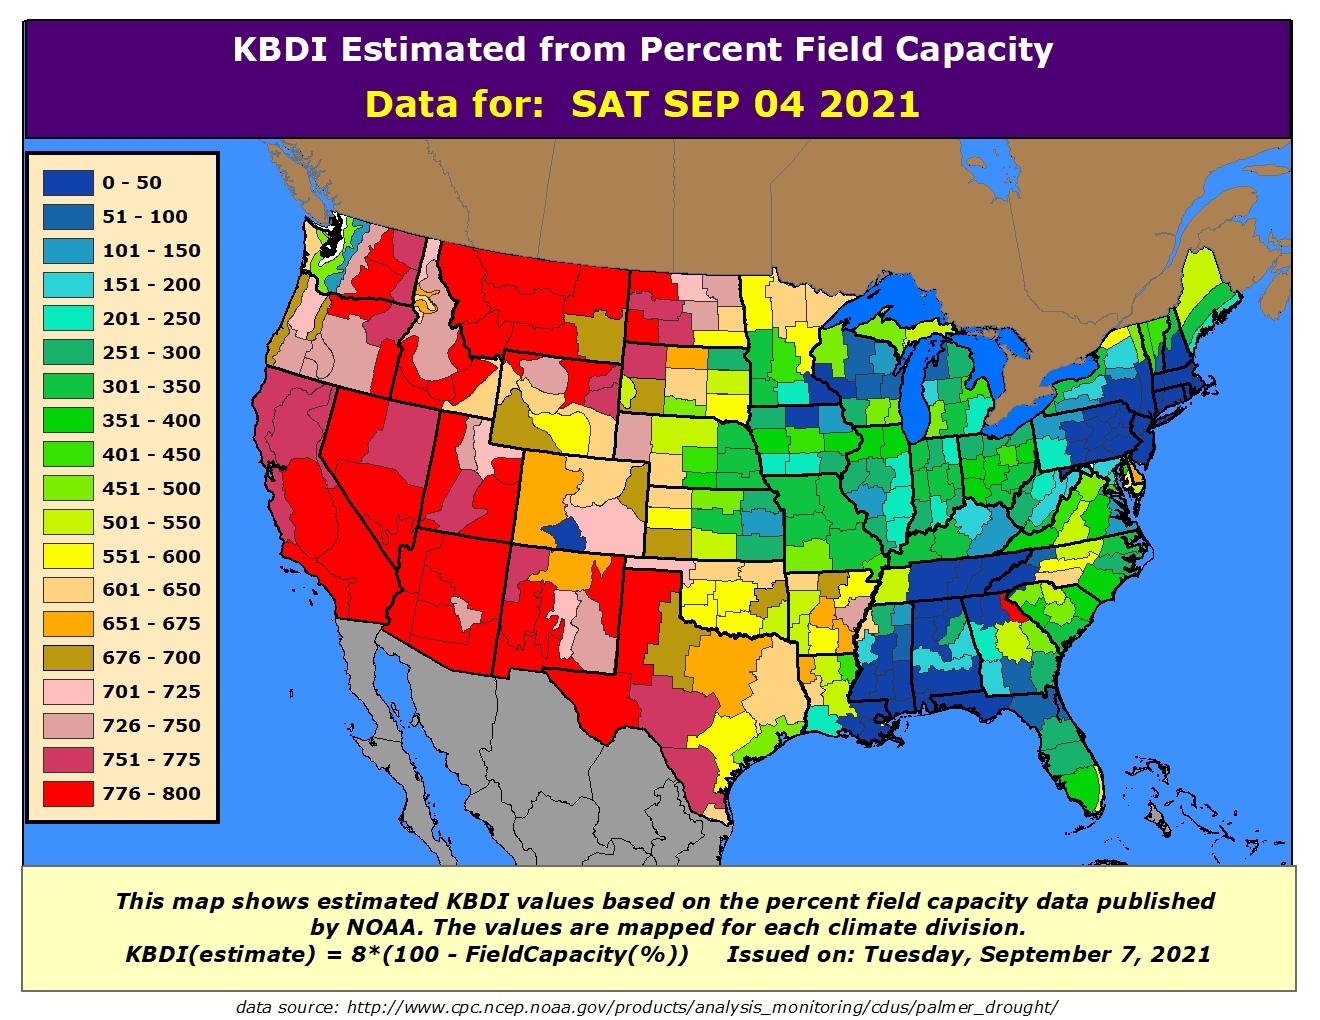
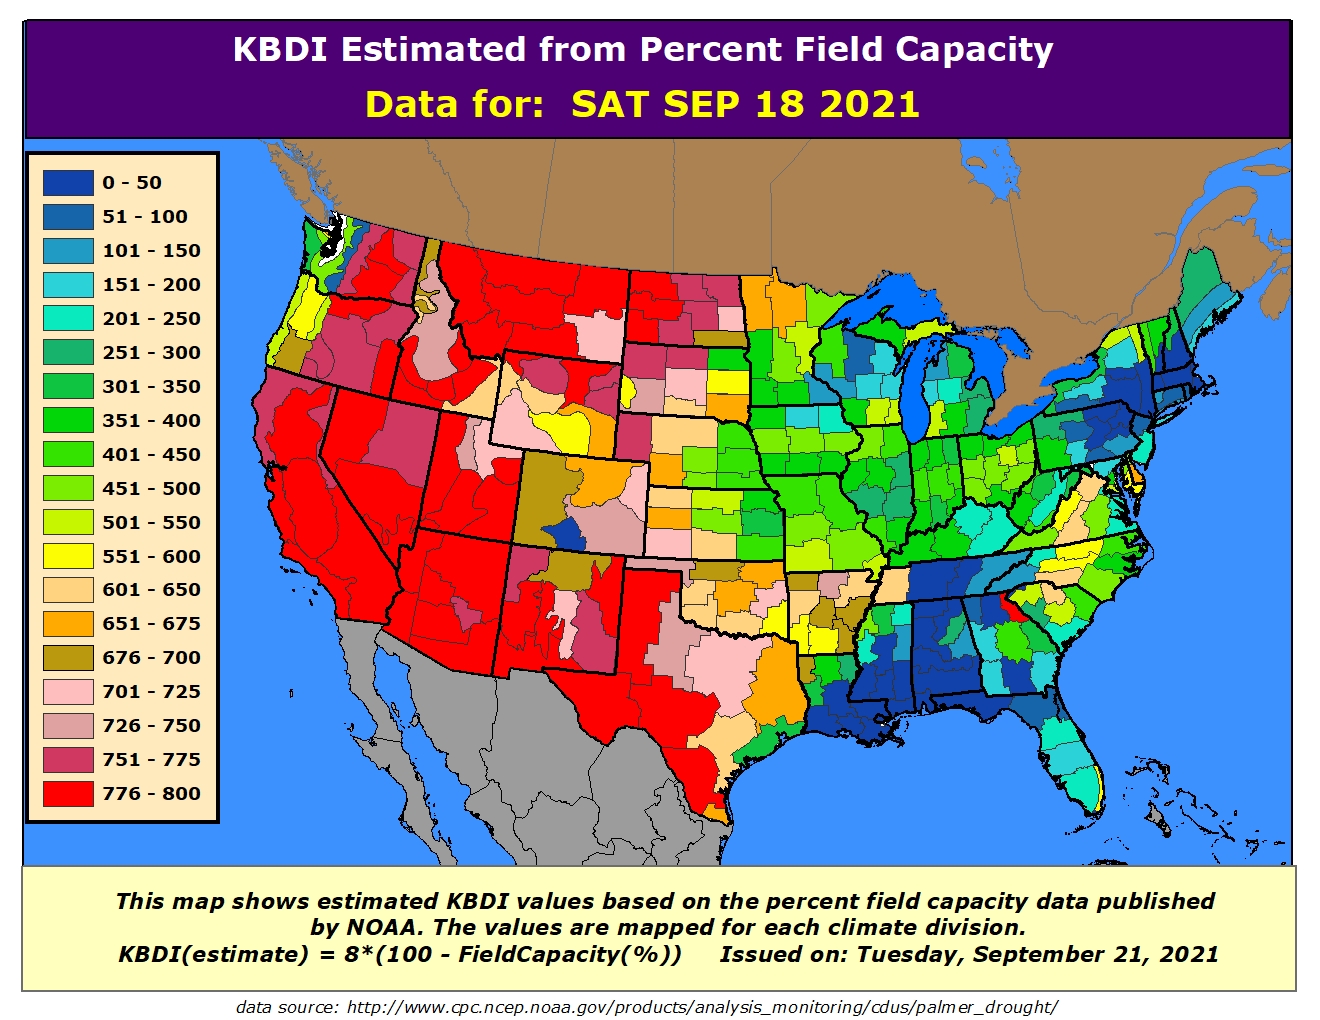
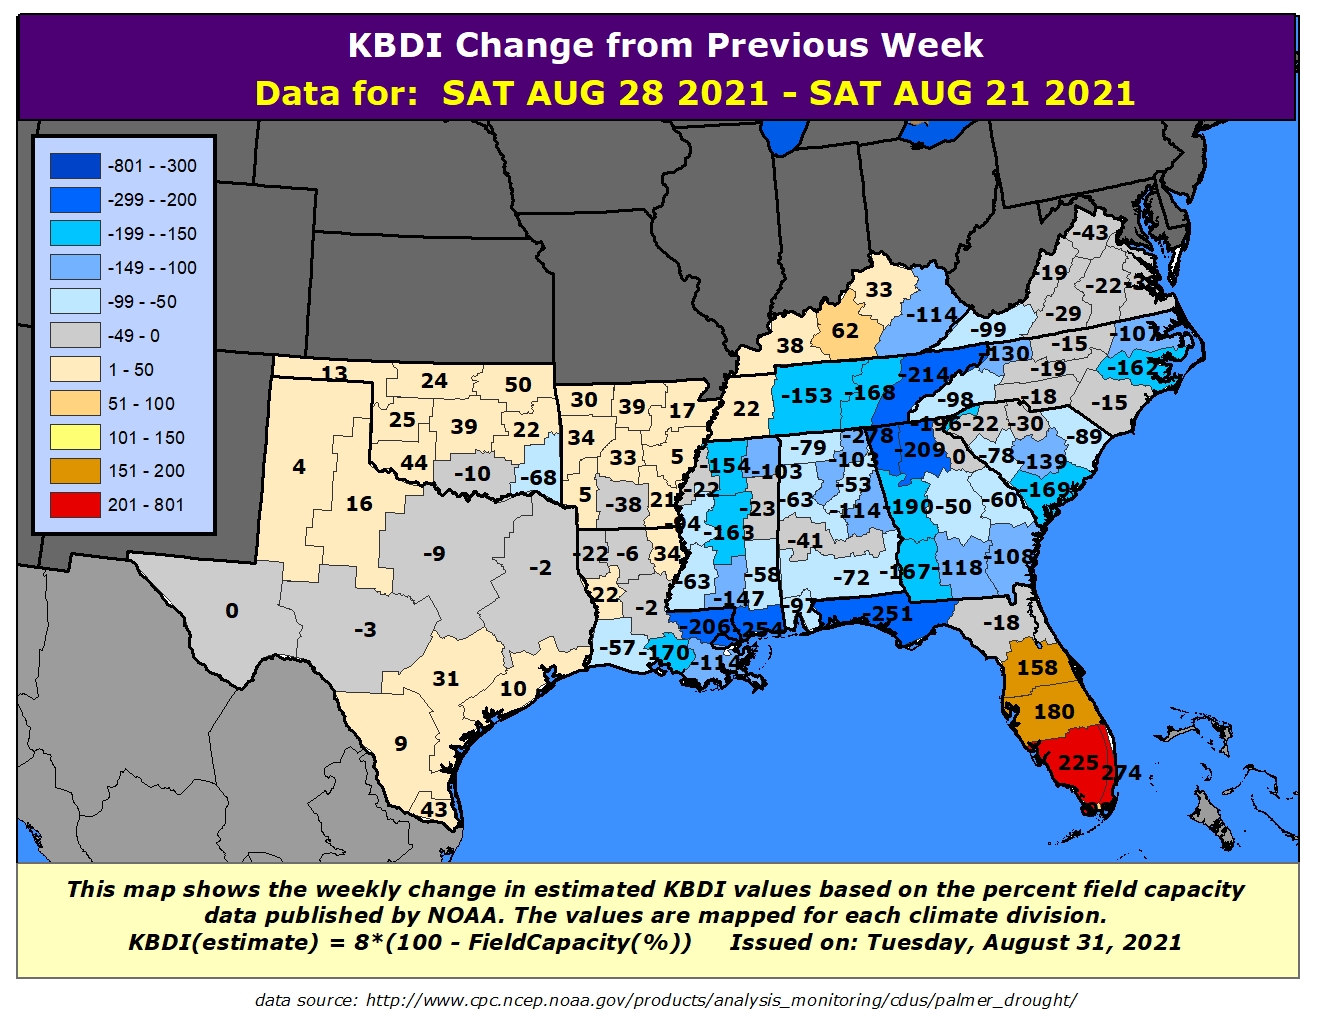
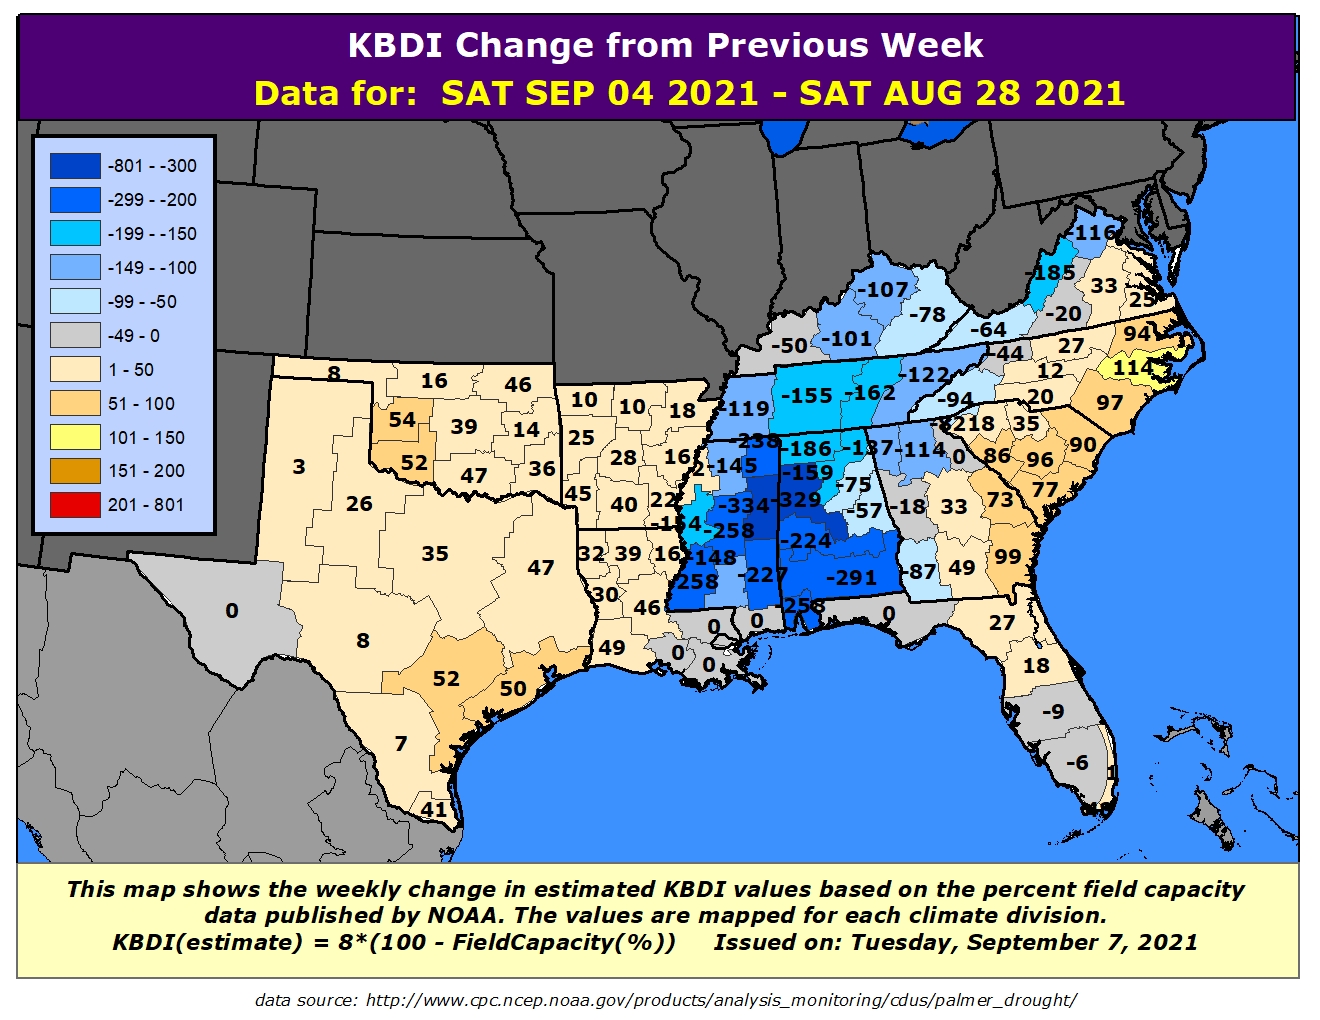
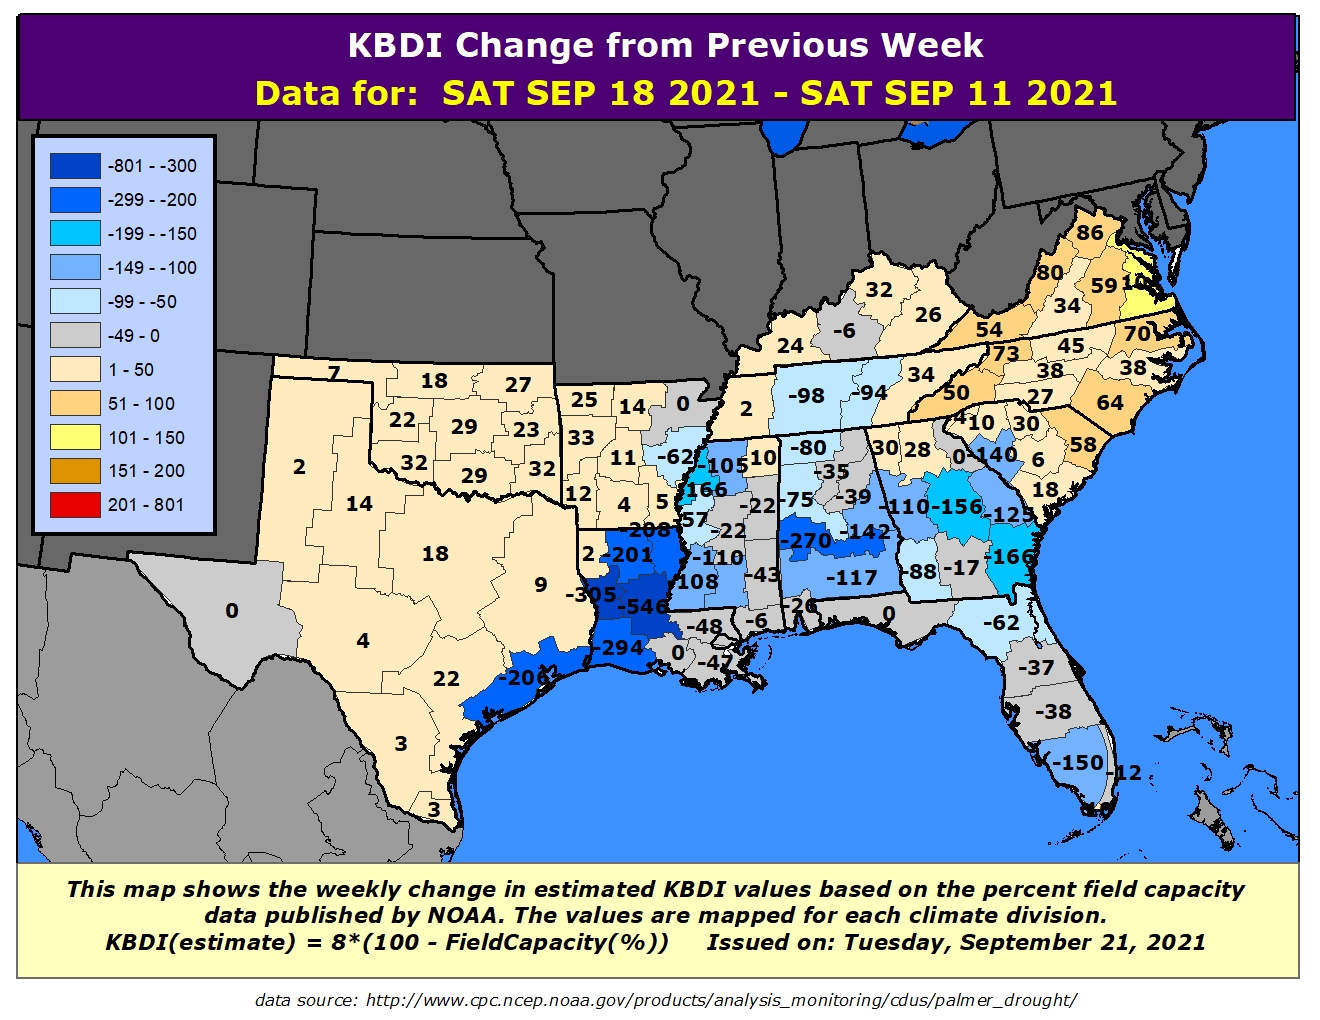
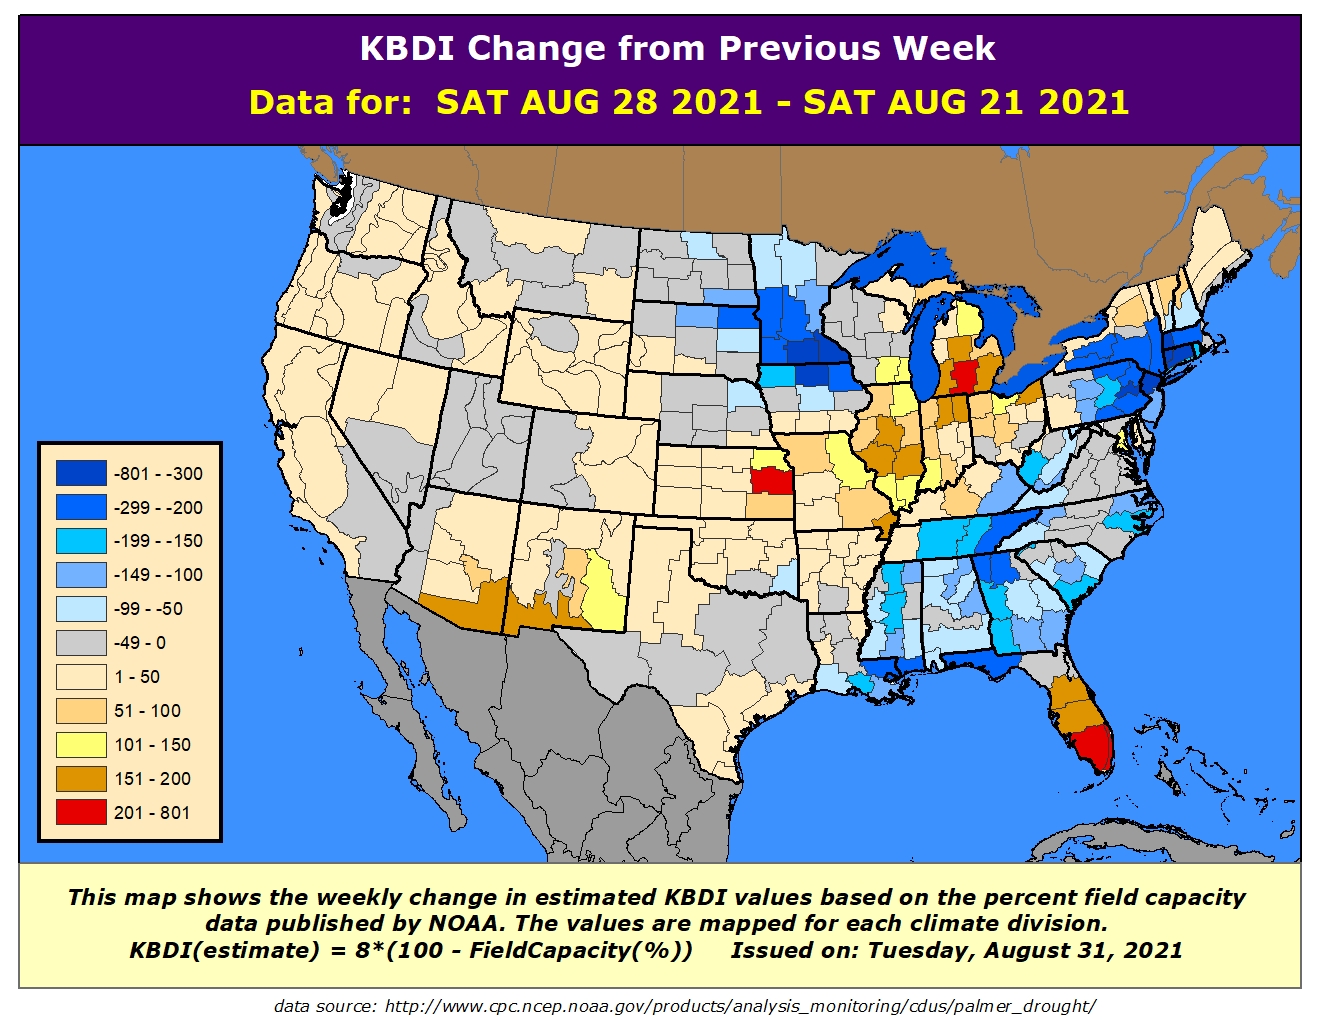
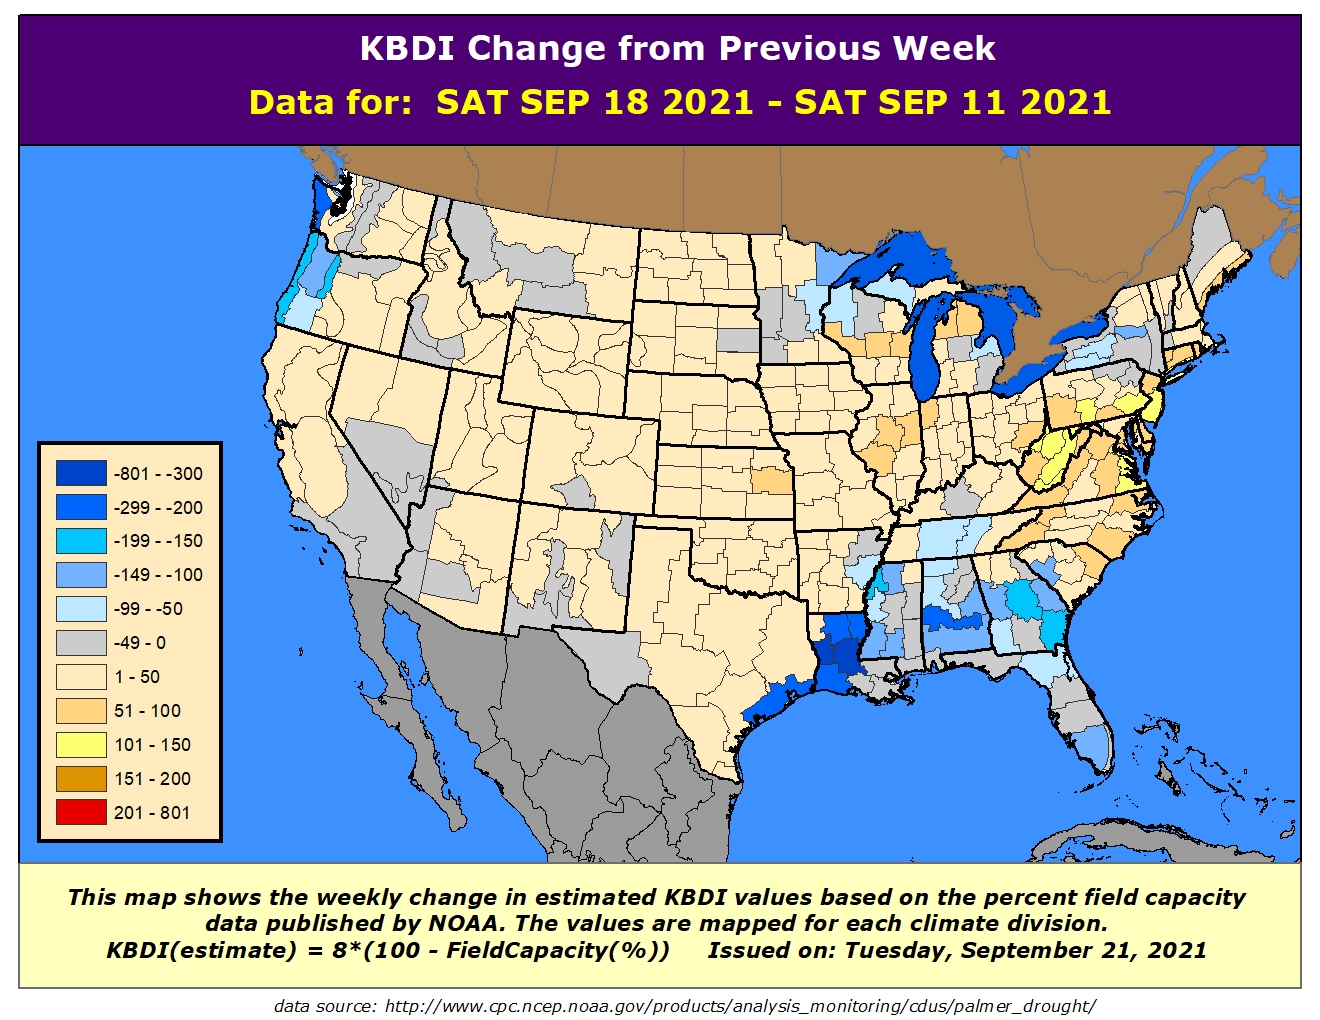
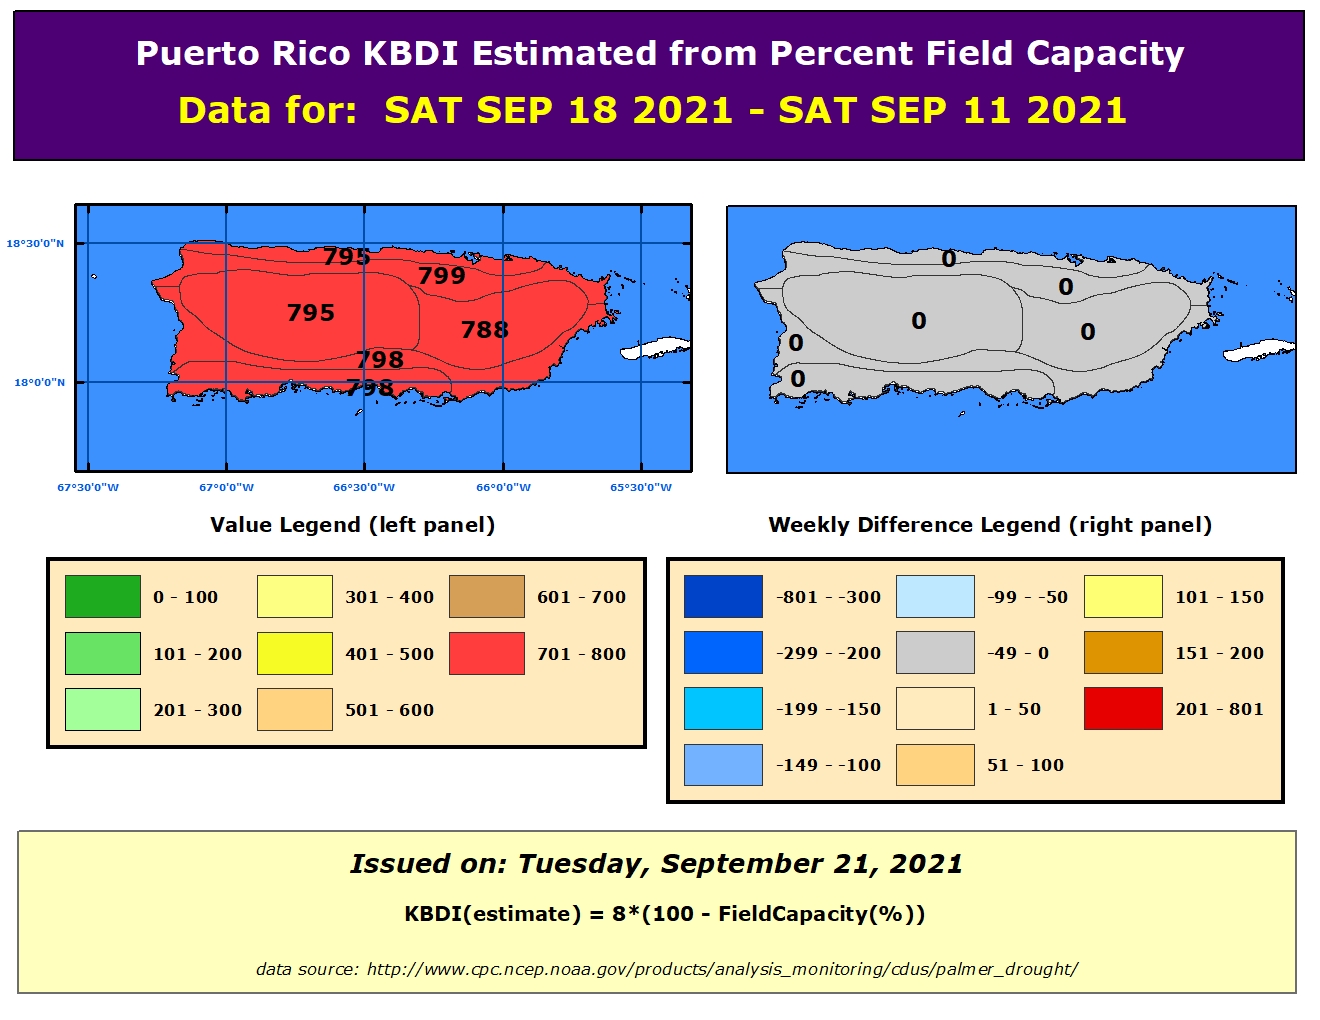
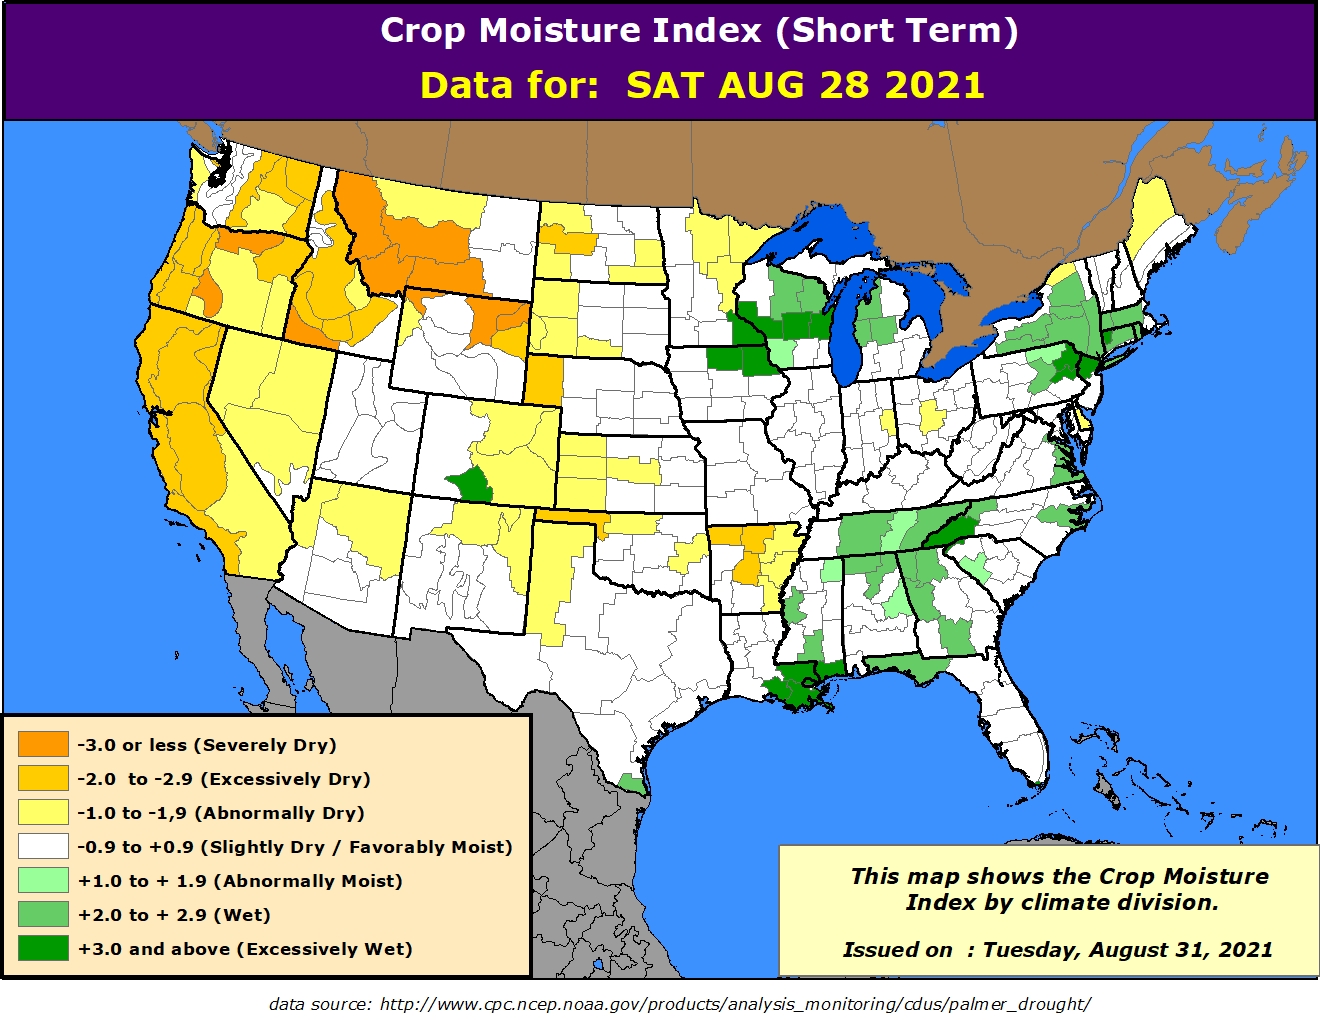
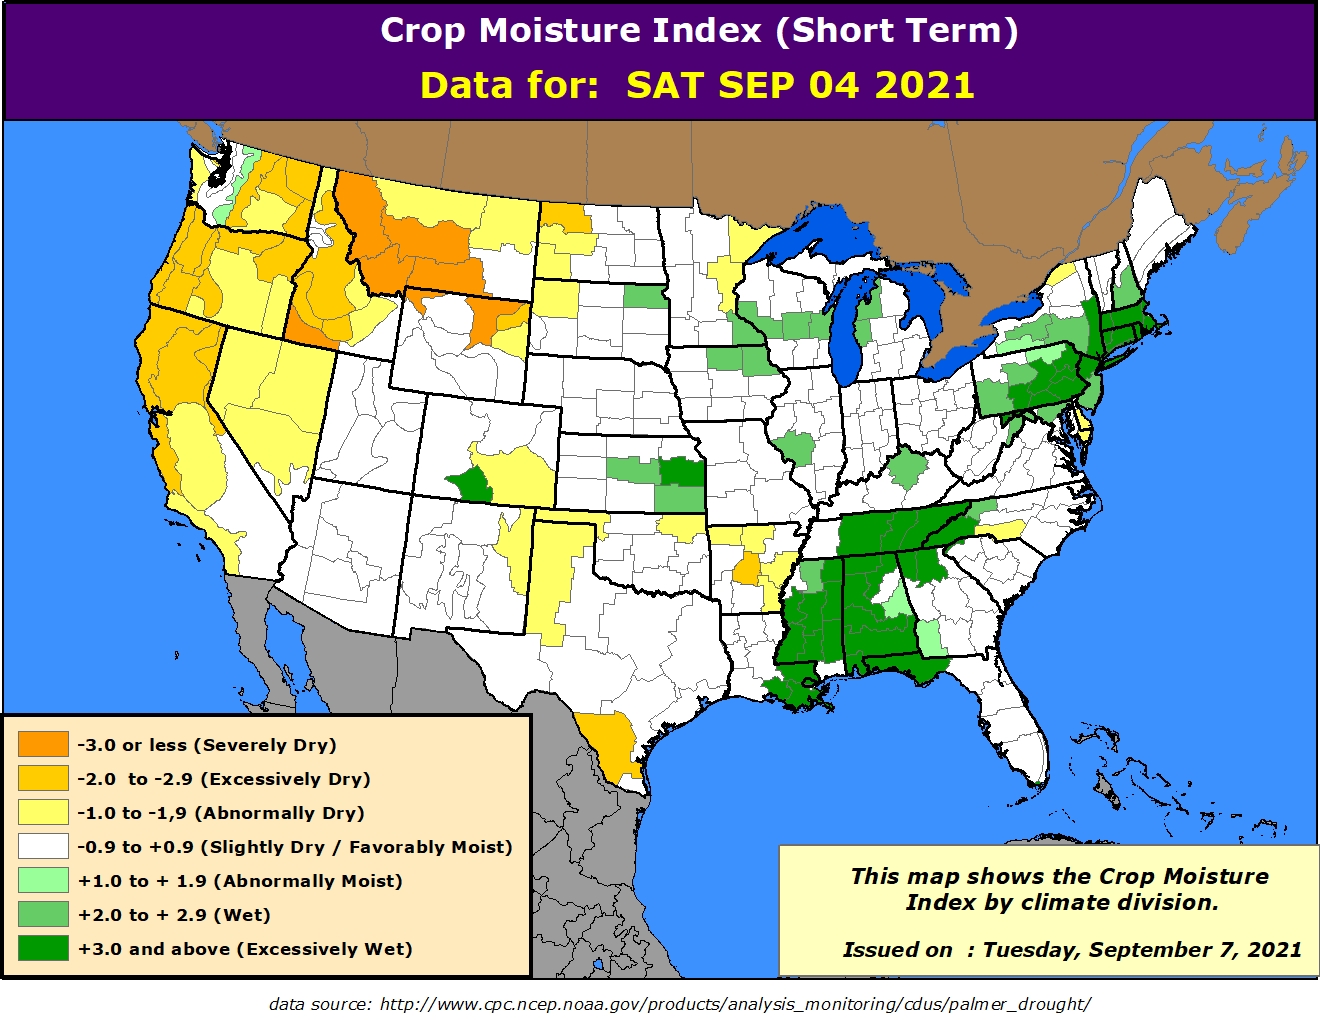
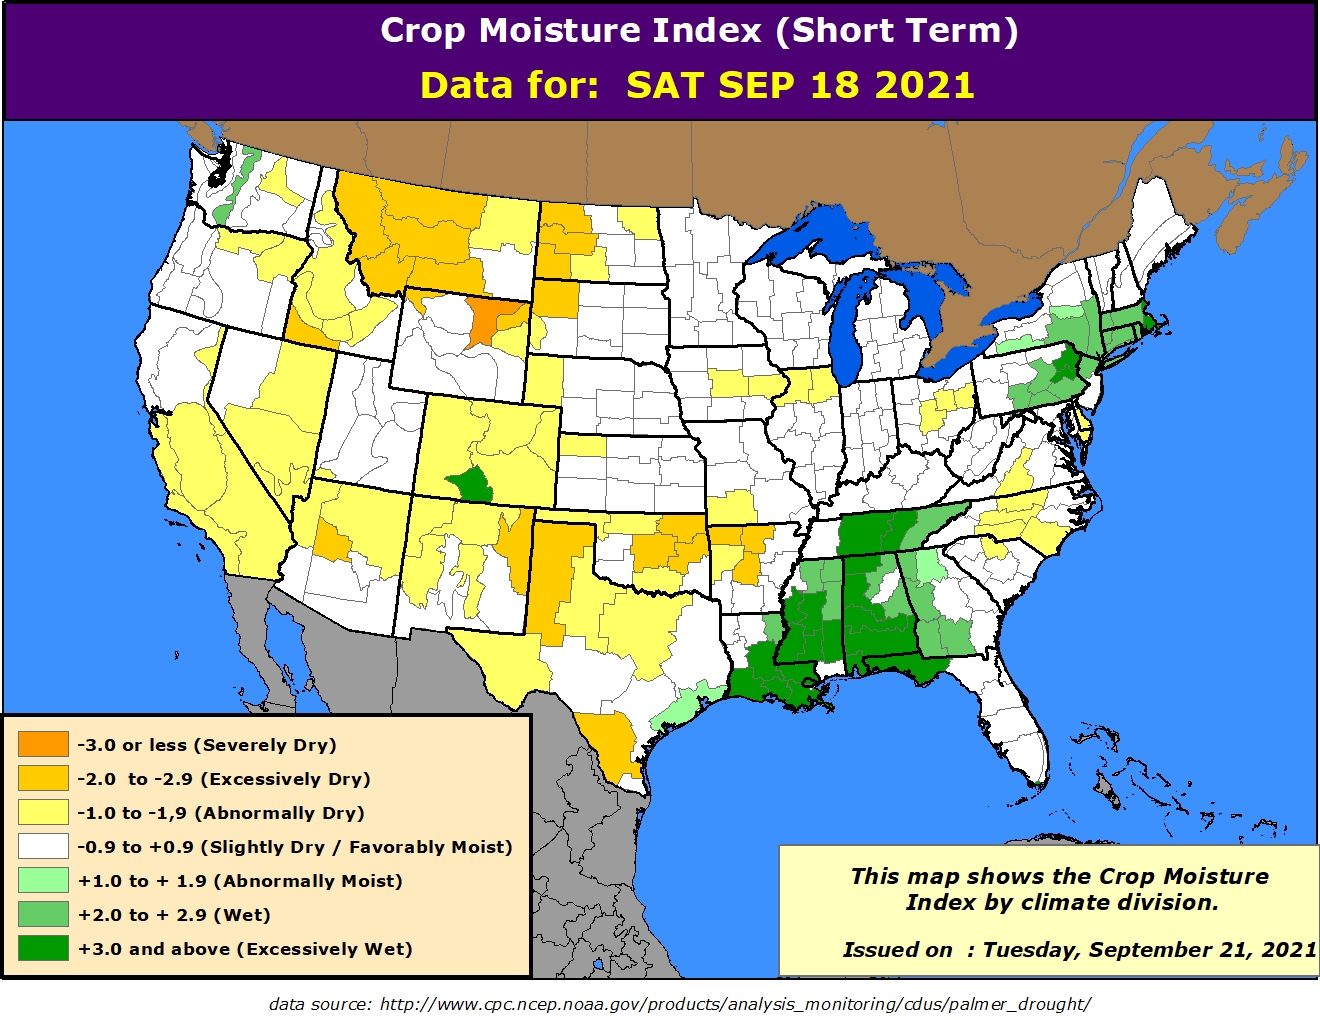
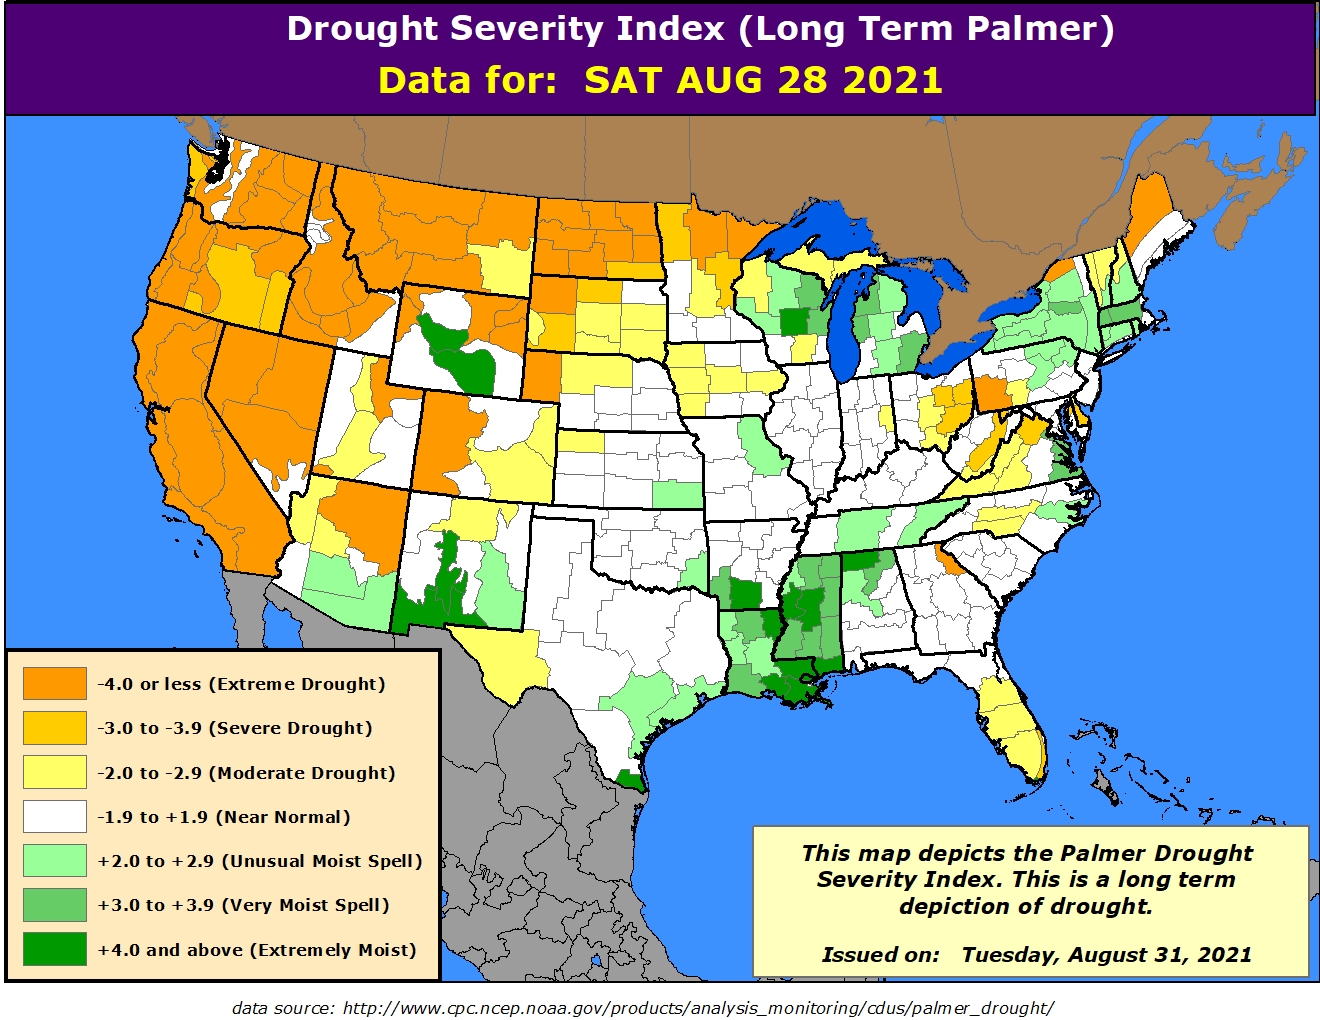
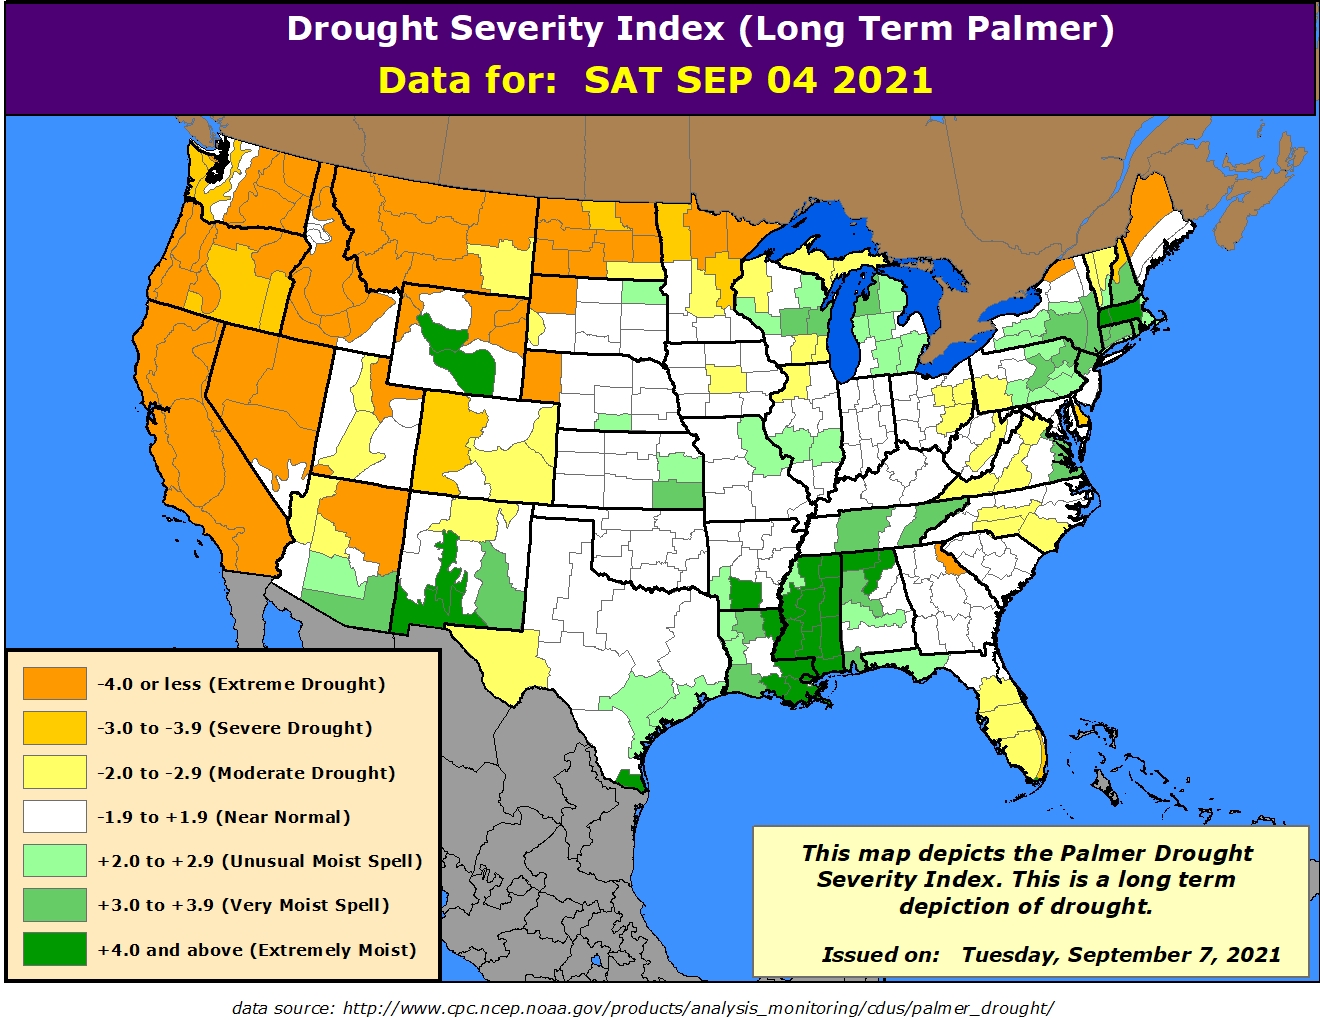
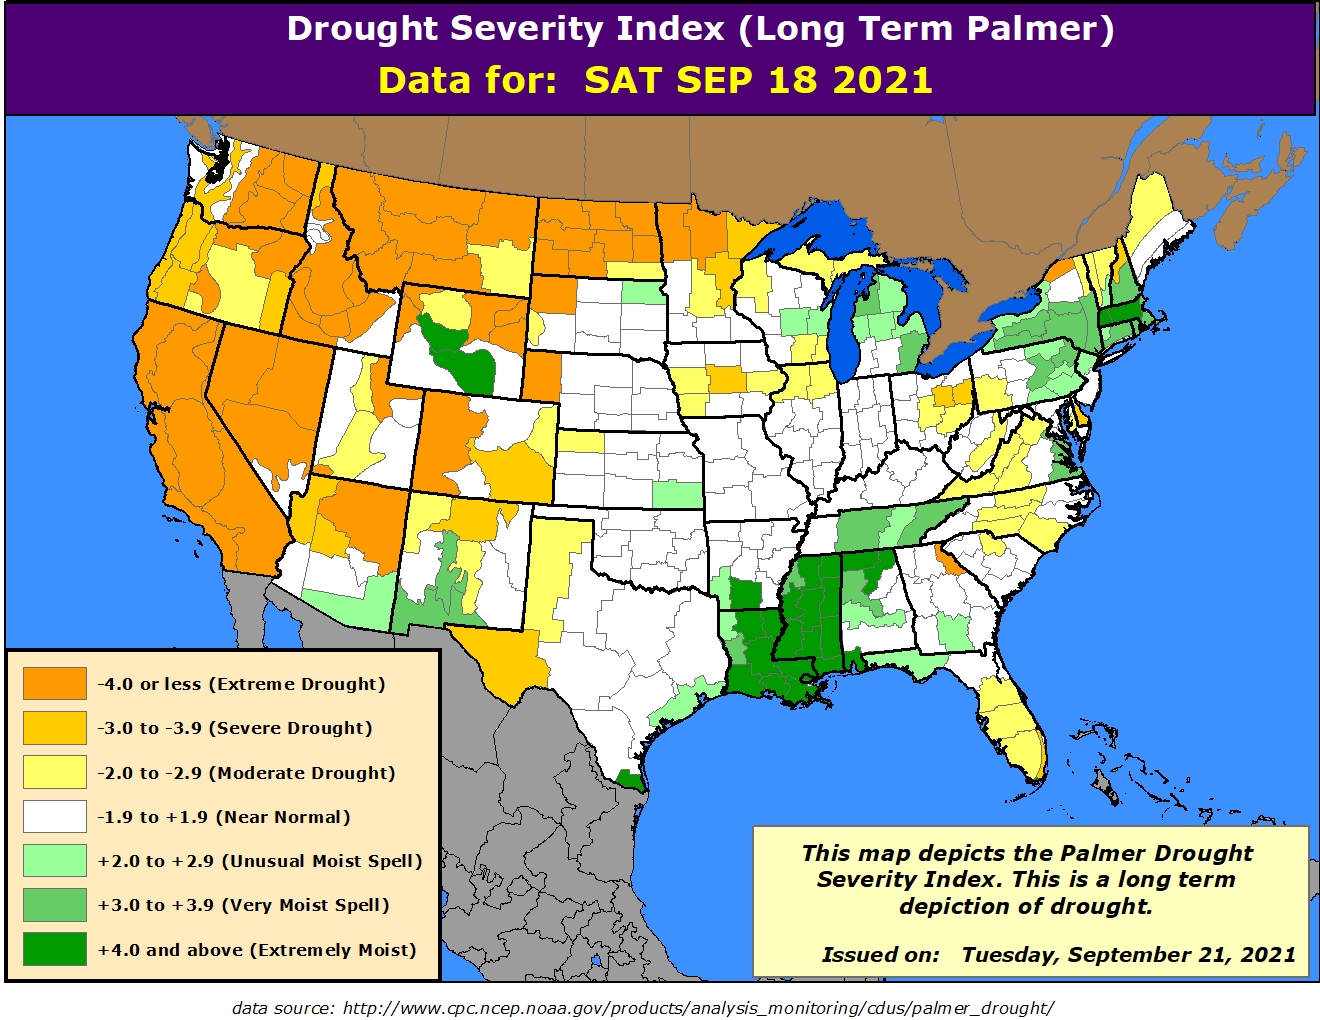
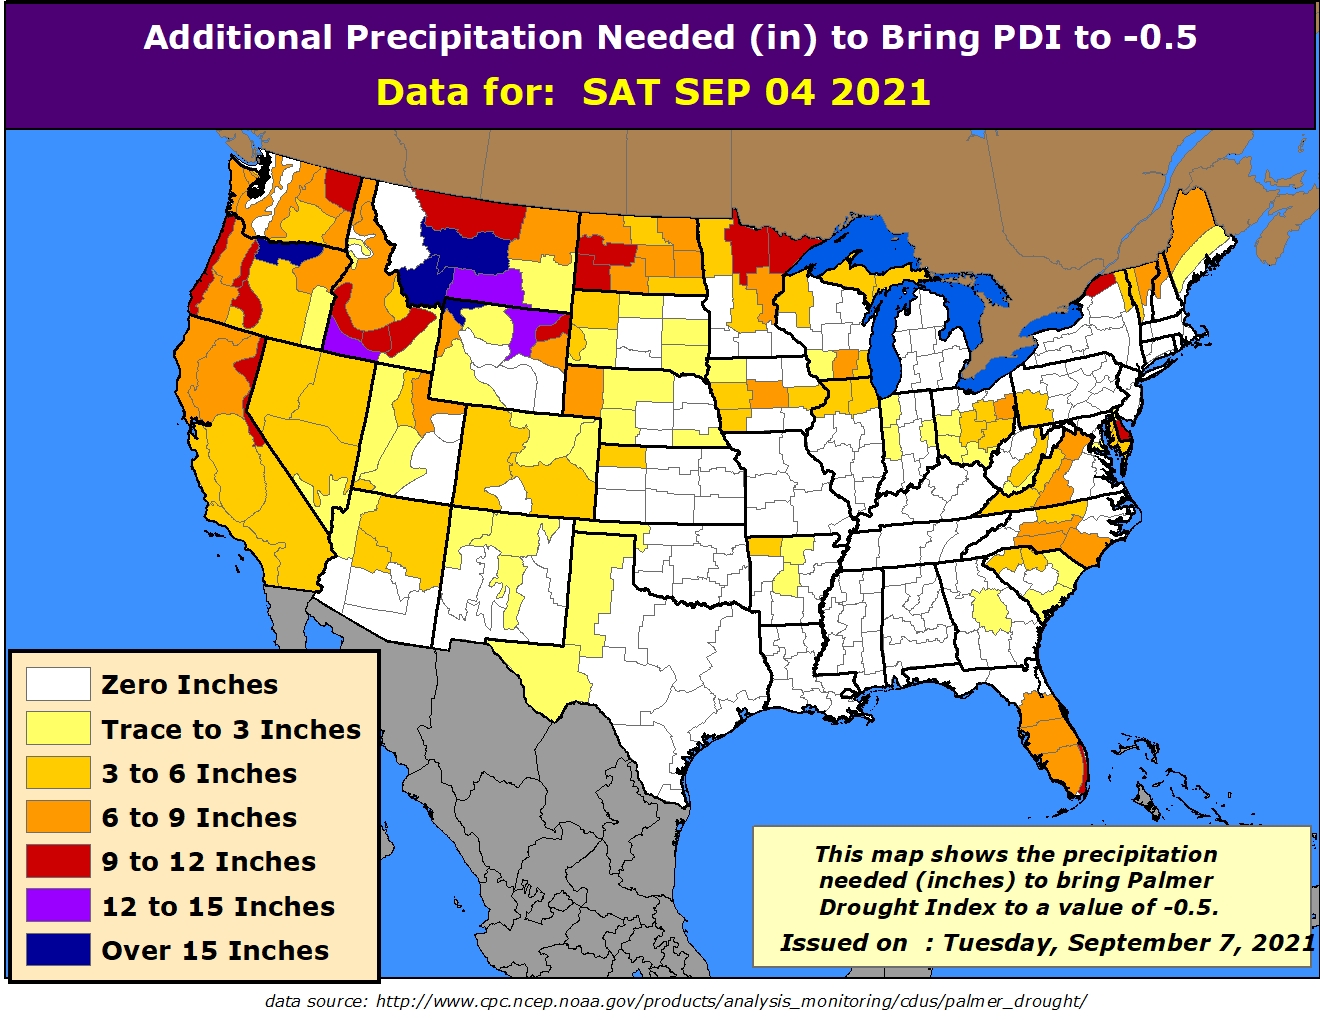
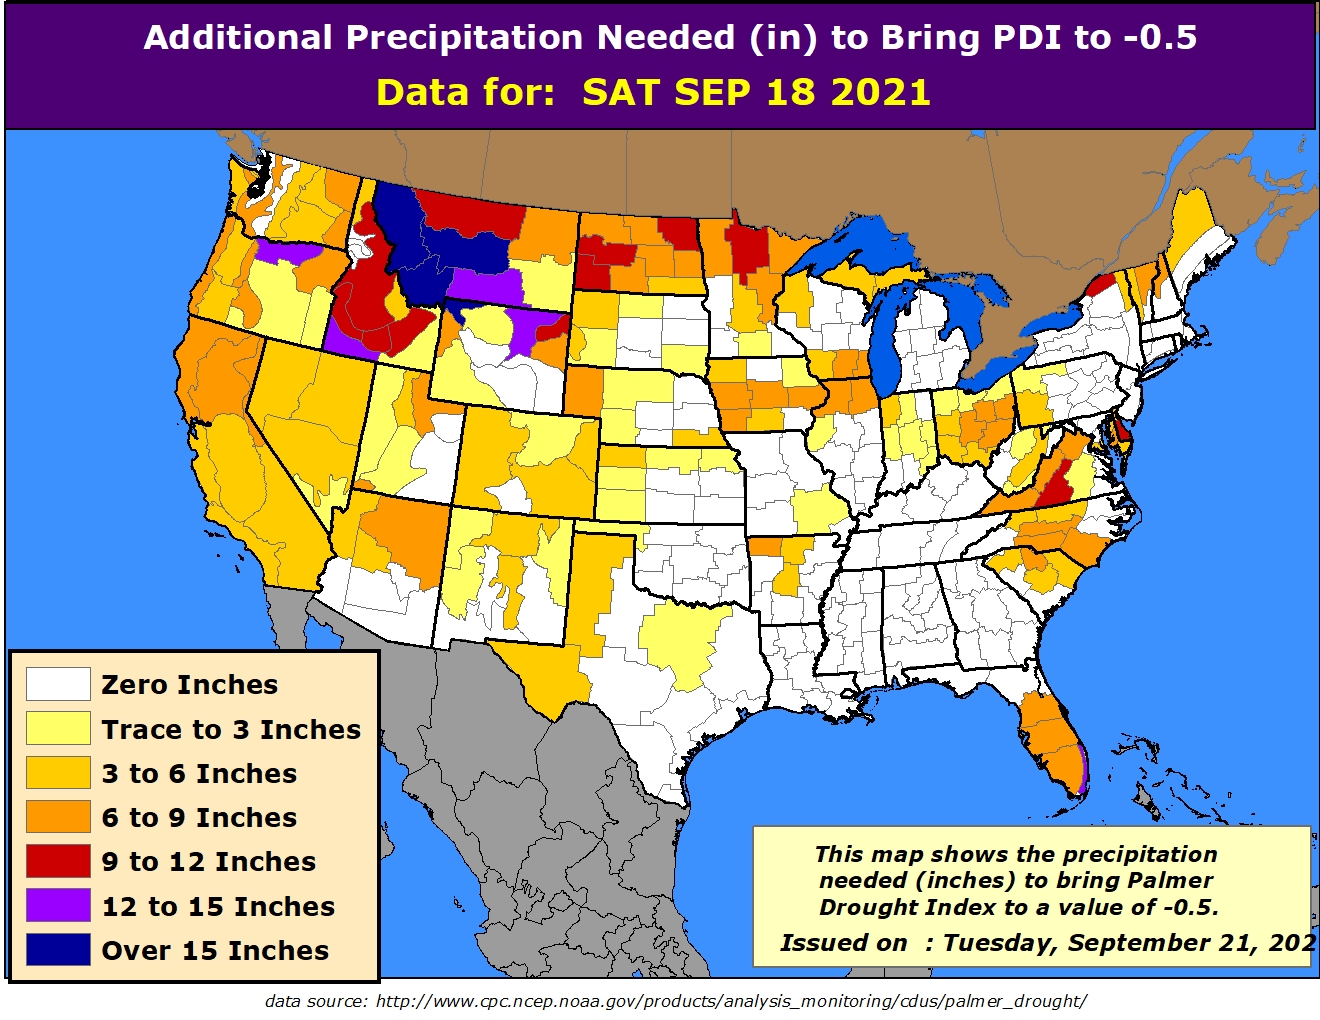
This page provides thumbnail images to eleven different drought related maps for the past four weeks. Each map is
hyperlinked to a larger image of the same map. The data are always dated on Saturday and are
typically updated Monday afternoon around 300 PM Eastern Time.
This chart was last updated on: Tuesday, September 21, 2021 at 09:37 AM. |
|
|||
| Related Links: | Link Page | Table of Values (4 Weeks) | Delimited Text | CPC Data Source | Shape File Source |
| Map Description | AUG 28 2021 | SEP 04 2021 | SEP 11 2021 | SEP 18 2021 | |
| Southern Area Smoothed |
|
|
|
|
|
| US Smoothed |
|
|
|
|
|
| Southern Area Climate Divisions |
|
|
|
|
|
| US Climate Divisions |
|
|
|
|
|
| US Climate Divisions Second Coloration |
|
|
|
|
|
| Southern Area Weekly Change |
|
|
|
|
|
| US Weekly Change |
|
|
|
|
|
| Puerto Rico |
|
|
|
|
|
| US Crop Moisture |
|
|
|
|
|
| US Palmer Drought Index |
|
|
|
|
|
| US PDI Additional Precipitation Needed |
|
|
|
|
|