PREDICTIVE SERVICES
  Intelligence
  Weather
  Fuels/Fire Danger
  Outlooks
   
LOGISTICS/ DISPATCH
  Aviation
  Crews
  Equipment/Supplies
  Overhead
   
ADMINISTRATIVE
  Incident Business Management
  Forms/References
  Safety Management
  Training
  All Hazard Response Guide
   
RELATED LINKS
  Southern Area
  National
[graphic] Color Curve


National Fire Danger Rating System (NFDRS)
Interactive NFDRS Indices Map for SA
ERC Percentile Quick Look
SA Predictive Service Areas Map
NFDRS Algorithm Flow Chart
Observations and Indices
All Daily Observations by State
24-Hour Forecasted Indices
ERC Charts
ERC-G Summary by PSA for Southern Area
100 hr and 1,000 hr Fuel Moisture Summary by PSA

Projected (DRI) National Map (Experimental Product)
ERC Anomaly Charts for Quick look Trends Days 1 -15

KBDI Reference Maps
(SACC Product)

 
Wildland Fire Assessment System (WFAS)
Main Page
  Observed Fire Danger
Forecast Fire Danger
Relative Humidity
24-Hour Rain Totals
Dew Point Levels
Haines Index
Lightning Ignition Efficiency
Fuel Moisture
 

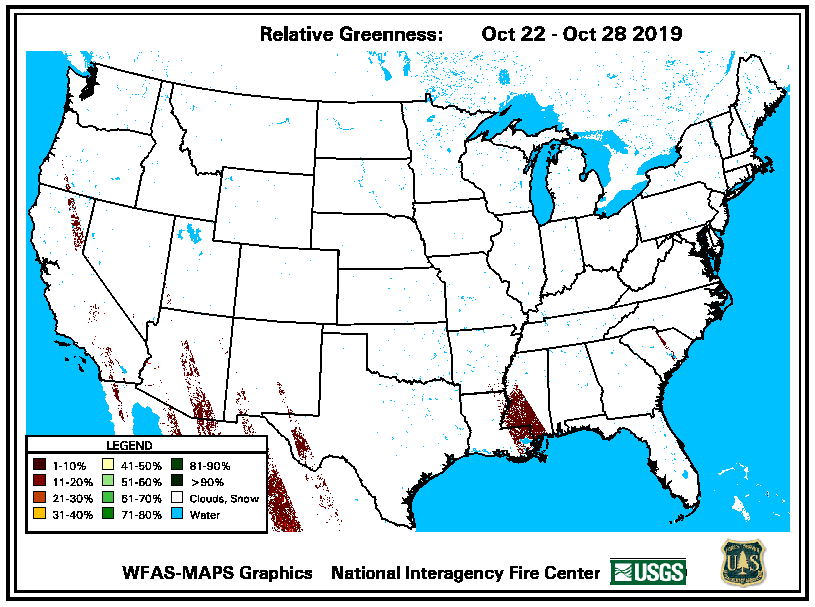
1000-Hour FM
Experimental Live Fuel Moisture
Relative Greenness
Departure - Avg Gre

enness
Archived Maps


Fire Behavior
SA Fire Behavior Forecast (Inactive)
Fire Behavior Advisory (Inactive)
Vegetation Greenness Indices

Normalized Difference Vegetation Index (NDVI - WFAS)

Southern Area Relative Greenness
SA Departure from Average Greenness
Growing Season Index (GSI)
Southern Area:
Map Site Data
National Map
Integrated Veg. Mapping Viewer (Zoom/Pan capable)
 
Live Fuel Moisture Program
State of Florida
 
Other Fire Danger Products
Southern Area Pocket Cards
National Pocket Cards
SA Hazardous Fuels Map
Gustav Assessment
 
[Graphic] - Your First Click to the Federal Government Website

home | about | disclaimer | contact us

Southern Area Coordination Center
1200 Ashwood Parkway, Suite 230, Atlanta, GA 30338
(678) 320-3000


>