
SOUTHWEST AREA WEATHER BRIEFING PAGE
CONDITIONS PAST 24 HOURS TO CURRENT...
1. Current Red Flag Warnings and Fire Weather Watches from NWS


2. Observed Precipitation - Past Day (top image) and Past Week (bottom image)


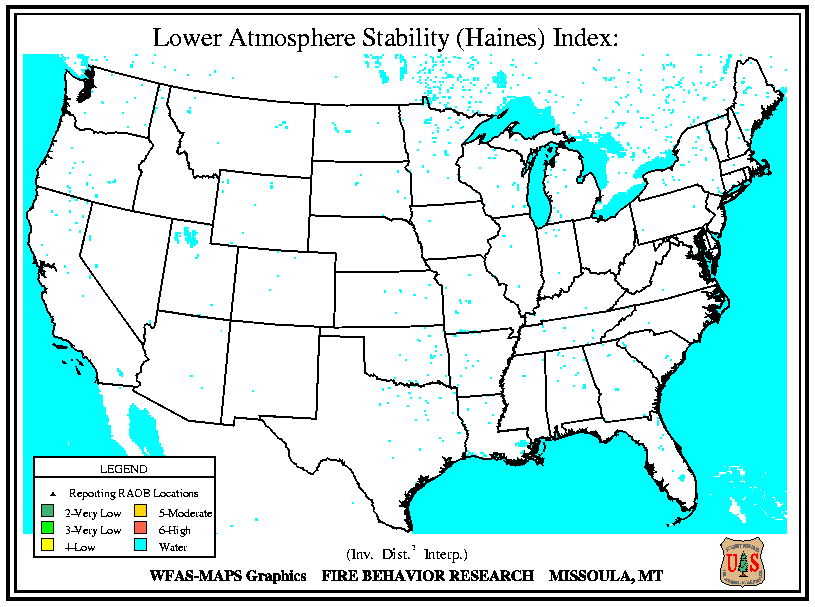
3. 0500 MDT Observed Haines Index(Red and Orange indicate very dry and unstable conditions)
4. Current National Water Vapor Image (Blue/purple = moist, dark = dry) - Click for Loop

5. Current Upper Level (18,000 ft MSL) Winds - Click for larger Image

6. Current 1-Hour National Radar Composite Loop (hit Refresh to update)
7. Current Southwest Visible Satellite - (Click for Animation)

8. Current Southwest US Surface Plot (Red=Temp, Green-Dewpoint, Winds are towards stations, 10kts lg. flag/5 kts for small)

CURRENT CONDITIONS...
|
9. Current Surface Dewpoints (Blue = Dry)
|
|
10. Current Surface Temperatures
|


FORECAST CONDITIONS (Next 24 to 48 Hours)...
11. Southwest Area Day 1 and Day 2 Fire Weather Outlooks


|
Day 1 - SPC National Fire Weather Outlook |
12. National Fire Weather Outlook from NOAA/NWS Storm
Prediction Center - Large scale weather features with expected Critical Fire
Weather Areas outlined in red. (Click
here for accompanying text discussion and Day 2 outlook) This
is for general, broad-scale planning and guidance purposes only and may
not be entirely consistent with the more detailed information provided by the
local NWS offices. |
 |
FORECAST CONDITIONS (Significant Trends Next 7+ Days)...
13. Forecast Total Rainfall Over Next 5 Days

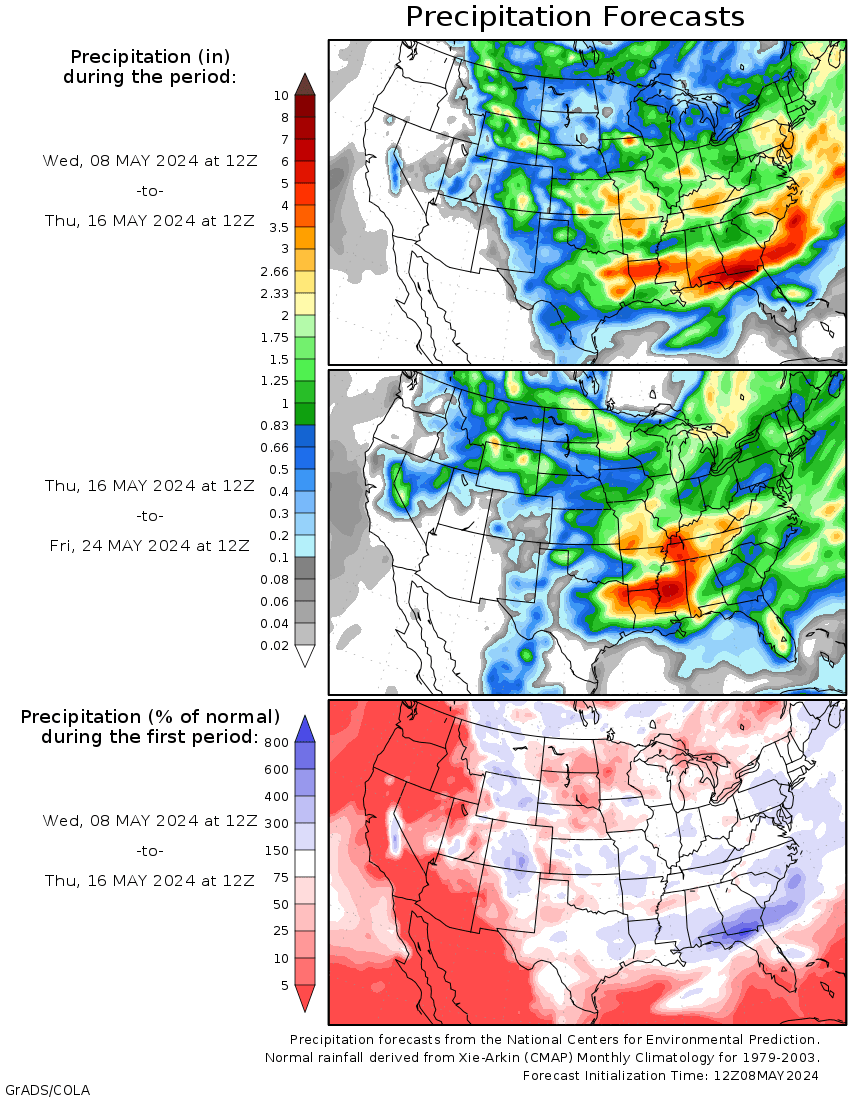
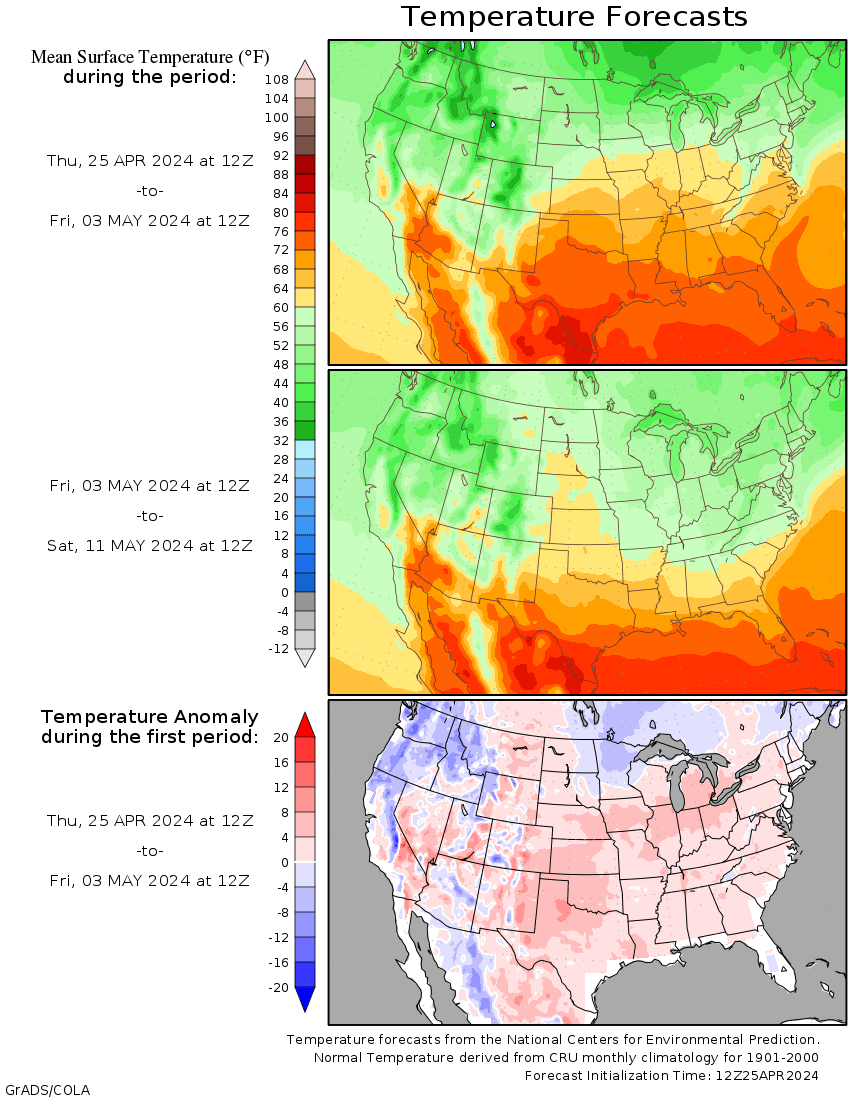
14. 15-Day Precipitation and Temperature Forecasts and Anomalies
15. Latest 7-Day Significant Fire Potential Outlook from Southwest Area Predictive Services
LONG TERM OUTLOOKS AND MISCELLANEOUS...
16. Southwest Predictive Services - Areal Depiction of Monthly Forecast Significant Fire Potential

17. Southwest Predictive Services - Seasonal Observed ERC Curve

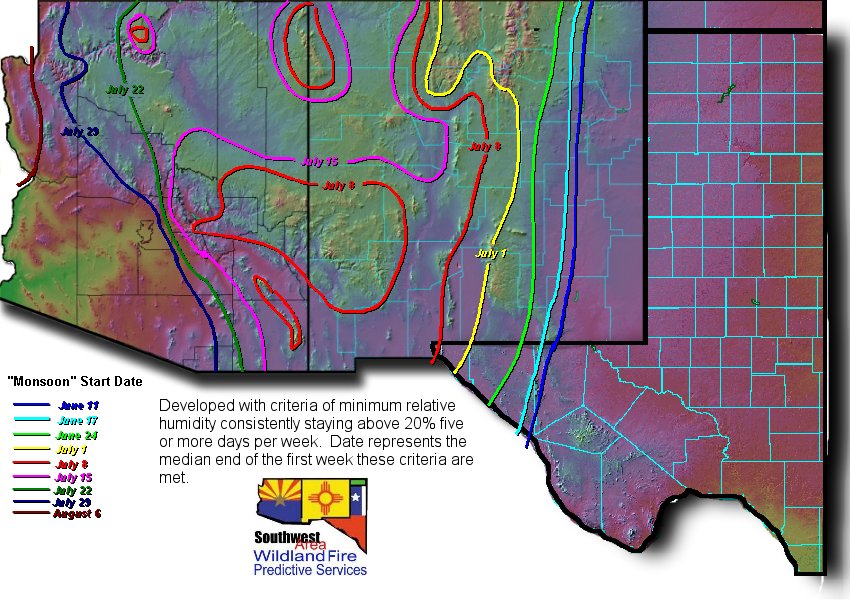
18. Median "Monsoon" Start Dates Based on Minimum RH Not < 20 % for More Than 2 Consecutive Days. This likely reflects a
significant season slowing event, affecting the severity of fire behavior
on existing fires and the potential for new project fires. |
 |
Home | Contact Us | Site Disclaimer
Southwest Coordination Center, Albuquerque, NM 87103
![]()
![]()
![]()
![]()
![]()
![]()
![]()