INCIDENT INFORMATION ...
 
PREDICTIVE SERVICES
  Intelligence
  Weather
  Fuels/Fire Danger
  Outlooks
   
LOGISTICS / DISPATCH
  Aviation
  Crews
  Equipment/
Supplies
  Overhead
  Visitor Package
   
ADMINISTRATIVE
  CA Coord. Group (CWCG) Website
  Policy and Reports
  Incident Business Management
  Safety Management
  Software Applications
  Training
   
RELATED LINKS
  National
  Regional
   
[graphic] Color Curve
 

PREDICTIVE SERVICE AREA CHARTS

Predictive Services Logoerc chart

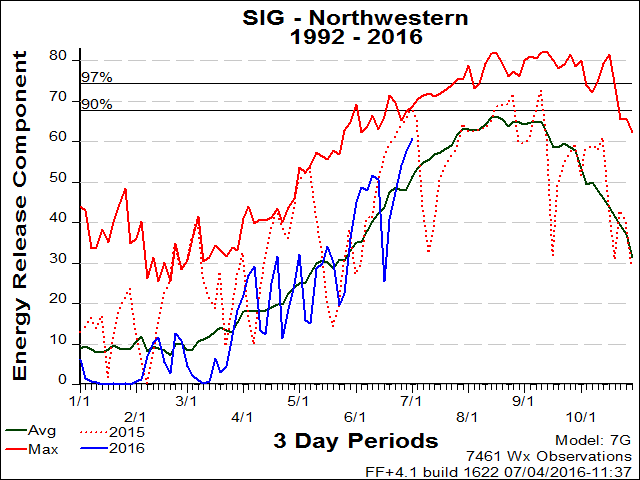
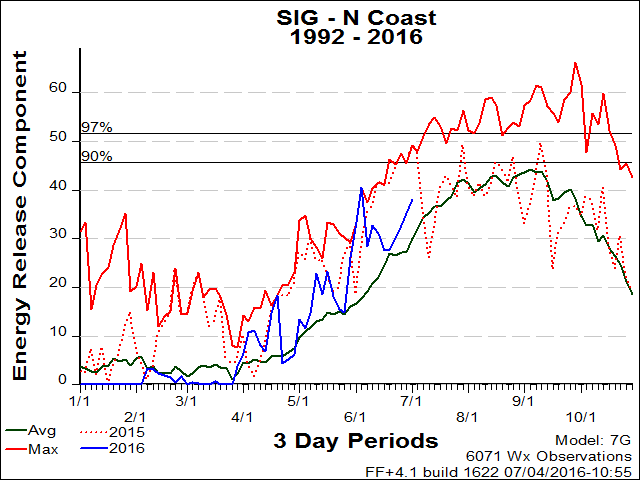
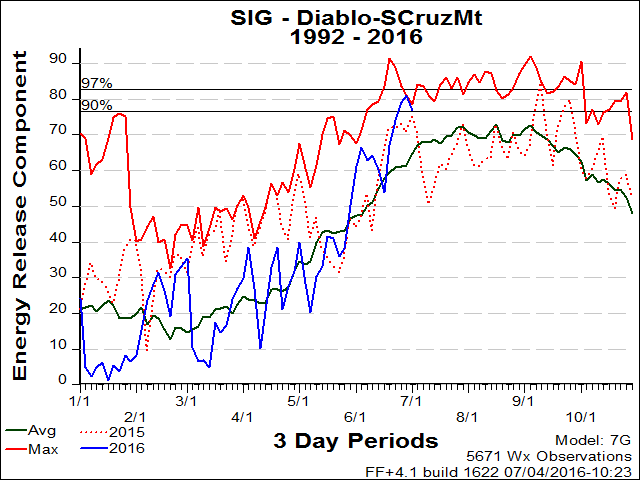
The Energy Release Component (ERC) is an NFDRS (National Fire Danger Rating System) index related to how hot a fire could burn. It is directly related to the 24-hour, potential worst case, total available energy (BTUs) per unit area (in square feet) within the flaming front at the head of a fire.

The ERC can serve as a good characterization of fire season as it tracks seasonal fire danger trends well. The ERC is a function of the fuel model and live and dead fuel moistures. Fuel loading, woody fuel moistures, and larger fuel moistures all have an influence on the ERC, while the lighter fuels have less influence and wind speed has none. ERC has low variability, and is the best fire danger component for indicating the effects of intermediate to long-term drying on fire behavior (if it is a significant factor) although it is not intended for use as a drought index.

Charts from each Forest Service severity weather station are arranged generally from the northern part of the Geographic Area to the southern part. Severity stations are those weather stations which represent the fire danger conditions on the Forest Unit. Because the Wet Flag was not recorded in AFFIRMS Data prior to mid-1993, these analyses start in 1994 and provide over 18 years of data. In addition, current and last years' data are graphed as auxillary runs to better provide recent comparative data to historical indicies.

Northwestern Mountains 
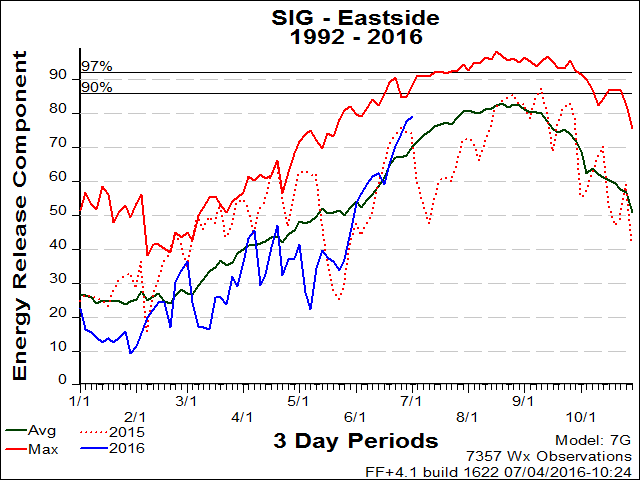
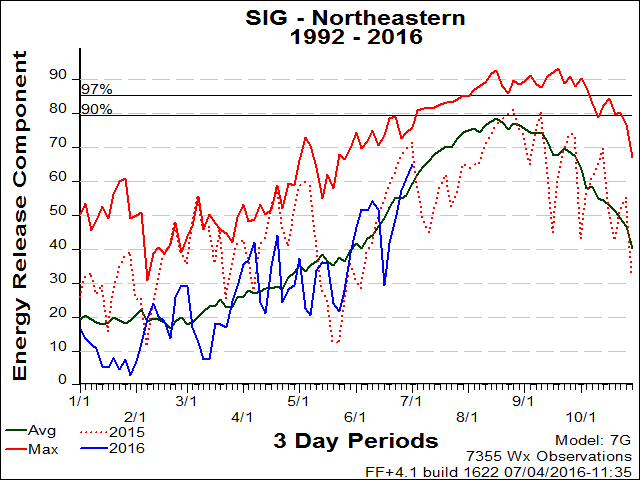
» Eastside » Northeastern 
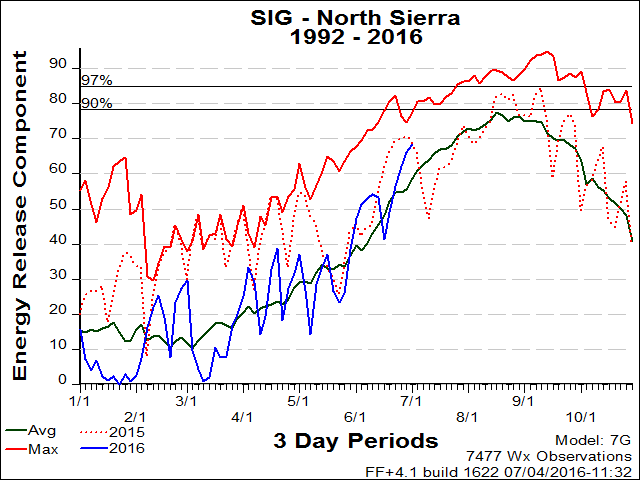
Mountains » Northern Sierra » 
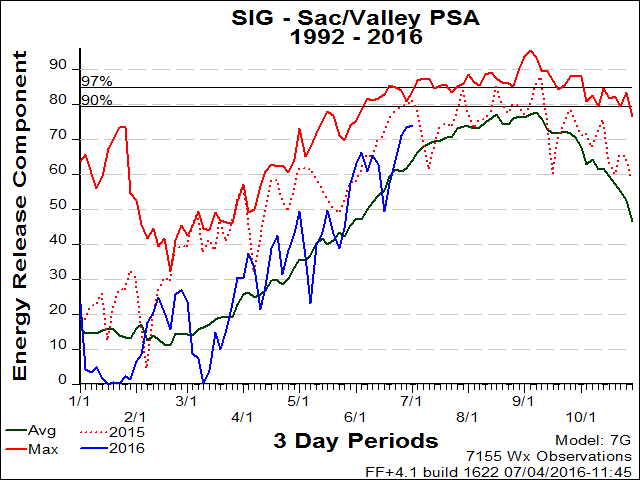
North Coast » Sacramento 
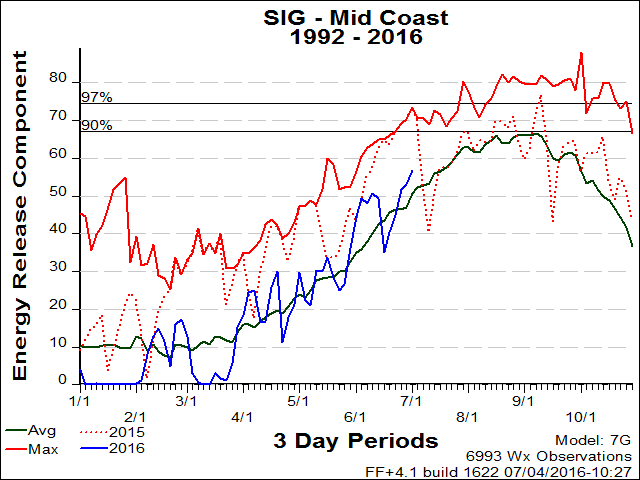
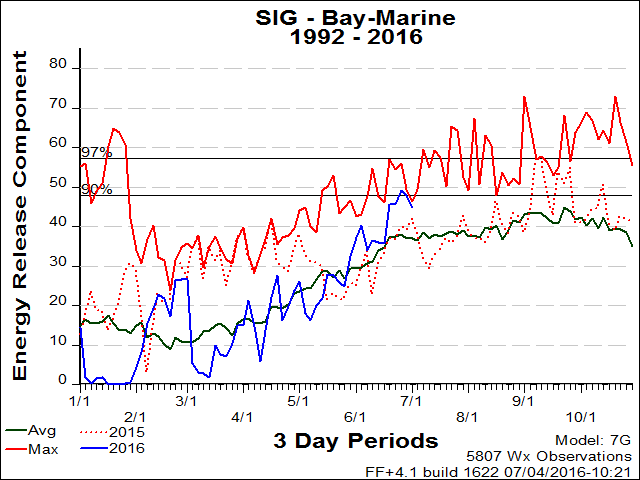
Valley » Mid Coast » Bay-Marine » Diablo Range-Santa Cruz Mtns.

 
PSA
CHARTS

NORTHWESTERN MOUNTAINS (PSA)

Oak Knoll
Sawyers Bar
Mt. Shasta
Pattymocus
Hoopa
Underwood
Quartz Hill
Ash Creek
Trinity Camp
Hayfork
Blue Ridge
Sugarloaf
Ruth
Camp Six
Five Cent

NFDRS Fuel Model:
Short Needle (Heavy Dead) (G)

Years Analyzed:
1993-2013

top

Northwestern PSA SIG ERC Graph

EASTSIDE (PSA)

Ravendale
Stampede
Dog Valley
Doyle
Barrel Springs
Laufman
Bull Flat
Juniper Springs

NFDRS Fuel Model:
Short Needle (Heavy Dead) (G)

Years Analyzed:
1993-2013

top

Eastside PSA SIG ERC Graph

NORTHEASTERN MOUNTAINS (PSA)

Rush Creek
Round Mtn.
Vanbremmer
Juniper Creek
Timber Mtn.
Devils Garden
Weed
Bear Flat
Cold Springs
Indian Well

NFDRS Fuel Model:
Short Needle (Heavy Dead) (G)

Years Analyzed:
1993-2013

top

Northeastern PSA SIG ERC Graph

NORTHERN SIERRA (PSA)

Ladder Butte
Quincy
Whitecloud
Bald Mtn.
Meyers/Baron
Soldier Mtn.
Manzanita Lake
Carpenter Ridge
Cashman
Westwood
Pike County
Gordon
Seedorchard
Beaver

NFDRS Fuel Model:
Short Needle (Heavy Dead) (G)

Years Analyzed:
1993-2013

top

Northern Sierra PSA SIG ERC Graph

NORTH COAST (PSA)

Schoolhouse
Westside
Eel River Camp
Gasquet
Kneeland

NFDRS Fuel Model:
Short Needle (Heavy Dead) (G)

Years Analyzed:
1993-2013

top

North Coast PSA SIG ERC Graph

Sac/Valley (PSA)

Redding
Stonyford
Lincoln
Eagle Peak
County Line
Whitmore
Bangor
Thomes Creek
Corning

NFDRS Fuel Model:
Short Needle (Heavy Dead) (G)

Years Analyzed:
1993-2013

top

Sacramento Valley/Foothills PSA SIG ERC Graph

MID COAST (PSA)

Rodeo Valley
Konocti
Boonville
Mendocino Pass
Eel River (MNF)
Soda Creek

NFDRS Fuel Model:
Short Needle (Heavy Dead) (G)

Years Analyzed:
1993-2013

top

Mid-Coast to Mendocino PSA SIG ERC Graph

BAY-MARINE (PSA)

Las Trampas
La Honda
Pulgas
Oakland North
Corralitos

NFDRS Fuel Model:
Short Needle (Heavy Dead) (G)

Years Analyzed:
1993-2013

top

Bay Area PSA SIG ERC Graph

DIABLO - SANTA CRUZ MTNs. (PSA)

Back Diamond
Rose Peak
Diablo Grande
Ben Lomond

NFDRS Fuel Model:
Short Needle (Heavy Dead) (G)

Years Analyzed:
1993-2013

top

Bay Area PSA SIG ERC Graph
   
 
[Graphic] - Your First Click to the Federal Government Website

home | about | disclaimer | contact us

Northern California Geographic Area Coordination Center
6101 Airport Road
Redding, CA 96002
530.226.2800