Central Oregon Fire Danger OutlookCOIDC · Northwest Coordination Center
Fire Danger Indices
Derived danger class per Fire Danger Rating Area: 5 observed days and a 7-day forecast. Thresholds are set per FDRA, so classes compare across areas. Today is highlighted; forecast days are italic. Today's column uses the 1300 forecast, which is what we staff and respond to; switch to Observed for the latest 1300 reading. index thresholds
Loading fire-danger indices…
Local Preparedness Level worksheet. The 5-Day ERC, Resource Commitment, Local Fire Activity, and GACC PL prefill from the feeds; click any cell to run a scenario. How to use this worksheet
Step 1 · 5-Day ERC Avg by FDRA
Step 2 · Score each input (0–4)
Step 3 · Sum → Preparedness Level
Step 4 · USDM drought adjustment
Per the COIDC Local Preparedness Level worksheet. USDM ≥ D3 holds the level; USDM < D3 subtracts one (floored at PL1).
Run Cards & Staffing
Nine run cards, one per dispatch block, each tied to a representative FDRA. Response runs off the 1300 forecast. A card runs at that FDRA's response level for the day. Summed, they are today's operational resource need. The goal is to fill every run card at least once.
Loading run cards…
Per-FDRA Detail
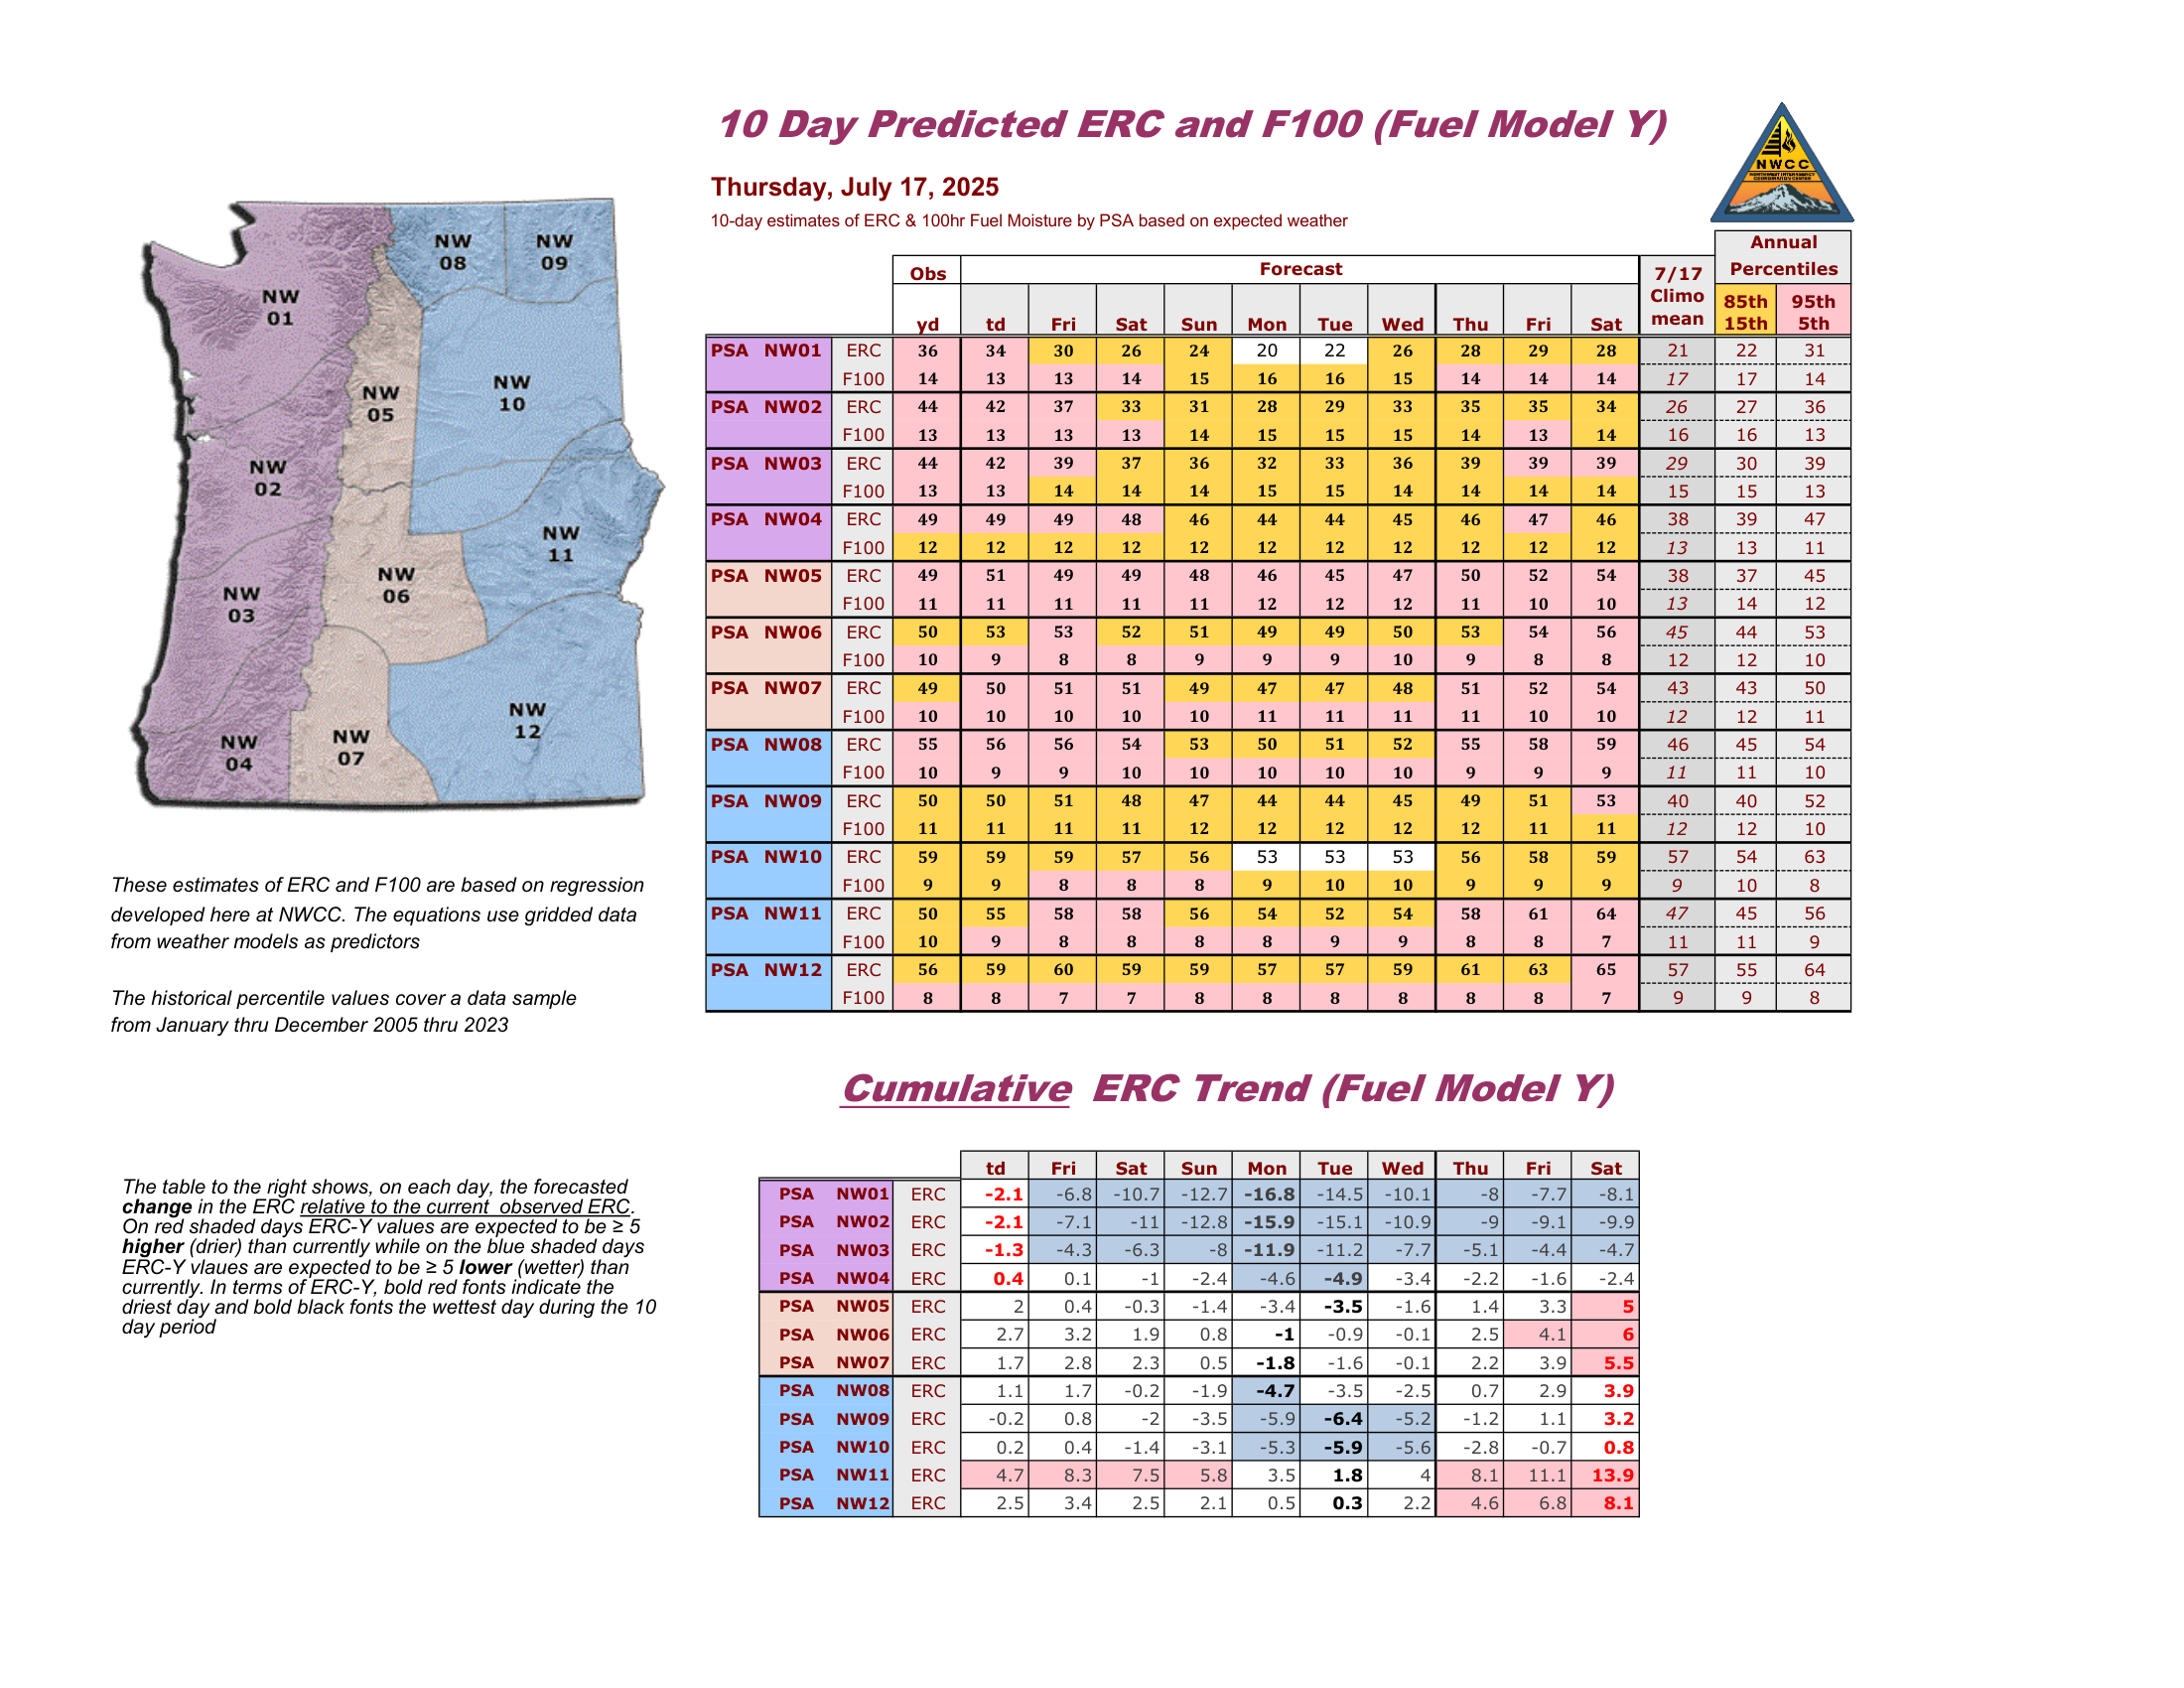
Each metric per FDRA, over its window. ERC, BI, and SFDI use equal-height class bands, so the line reads as position within a band. The 100 and 1000-hour dead fuel plots show raw percent against a dashed period-of-record normal. Temp/RH departure overlays both around a zero line (■ Temp, ■ RH). When temperature runs above normal and RH below, the gap between them widens, and that spread is the dry signal. Observed days only. Solid is observed, dashed is forecast.
Loading detail plots…
Live Fuel Moisture
This season's crew samples against each site's historic range, by species. The shaded band is the 10th to 90th percentile of past years; the dashed line is the historic median. A point turns red below the historic 10th percentile or below critical. Sites run north to south. Click any chart to enlarge.
Loading live fuel moisture…
Local Preparedness Level — how to use this worksheet
Evaluated weekly and in effect for the operational week unless fire activity, resource commitment, or the forecast change enough to reassess. The worksheet supports the call; it does not set the level on its own. Final determination rests with Fire Management leadership.
1. 5-Day ERC Avg
Daily Unit ERC is the average of the six per-FDRA ERC values. Score the 5-day average against the unit cuts: Low 0–27, Moderate 28–41, High 42–50, Very High 51–57, Extreme 58+.
2. Resource Commitment
Total engines, handcrews, and wildfire modules committed (from IROC and WildCAD; exclude lend-lease on local incidents and prepositioned GACC resources). None 0; Light 1–5; Medium 6–8; High 9–11; Heavy 12+.
3. Local Fire Activity
Wildfire or prescribed, from COIDC dispatch. None; Light (contained in one burn period, local resources); Medium (up to 2 initial-attack fires per week in 2 or more divisions); High (most divisions with daily new starts, extended attack common); Heavy (initial attack compromised, IMTs active).
4. Geographic (GACC) PL
Use the current Northwest regional level from the NWCC homepage. PL1 = 0 through PL5 = 4.
5. 7-Day Significant Fire Potential
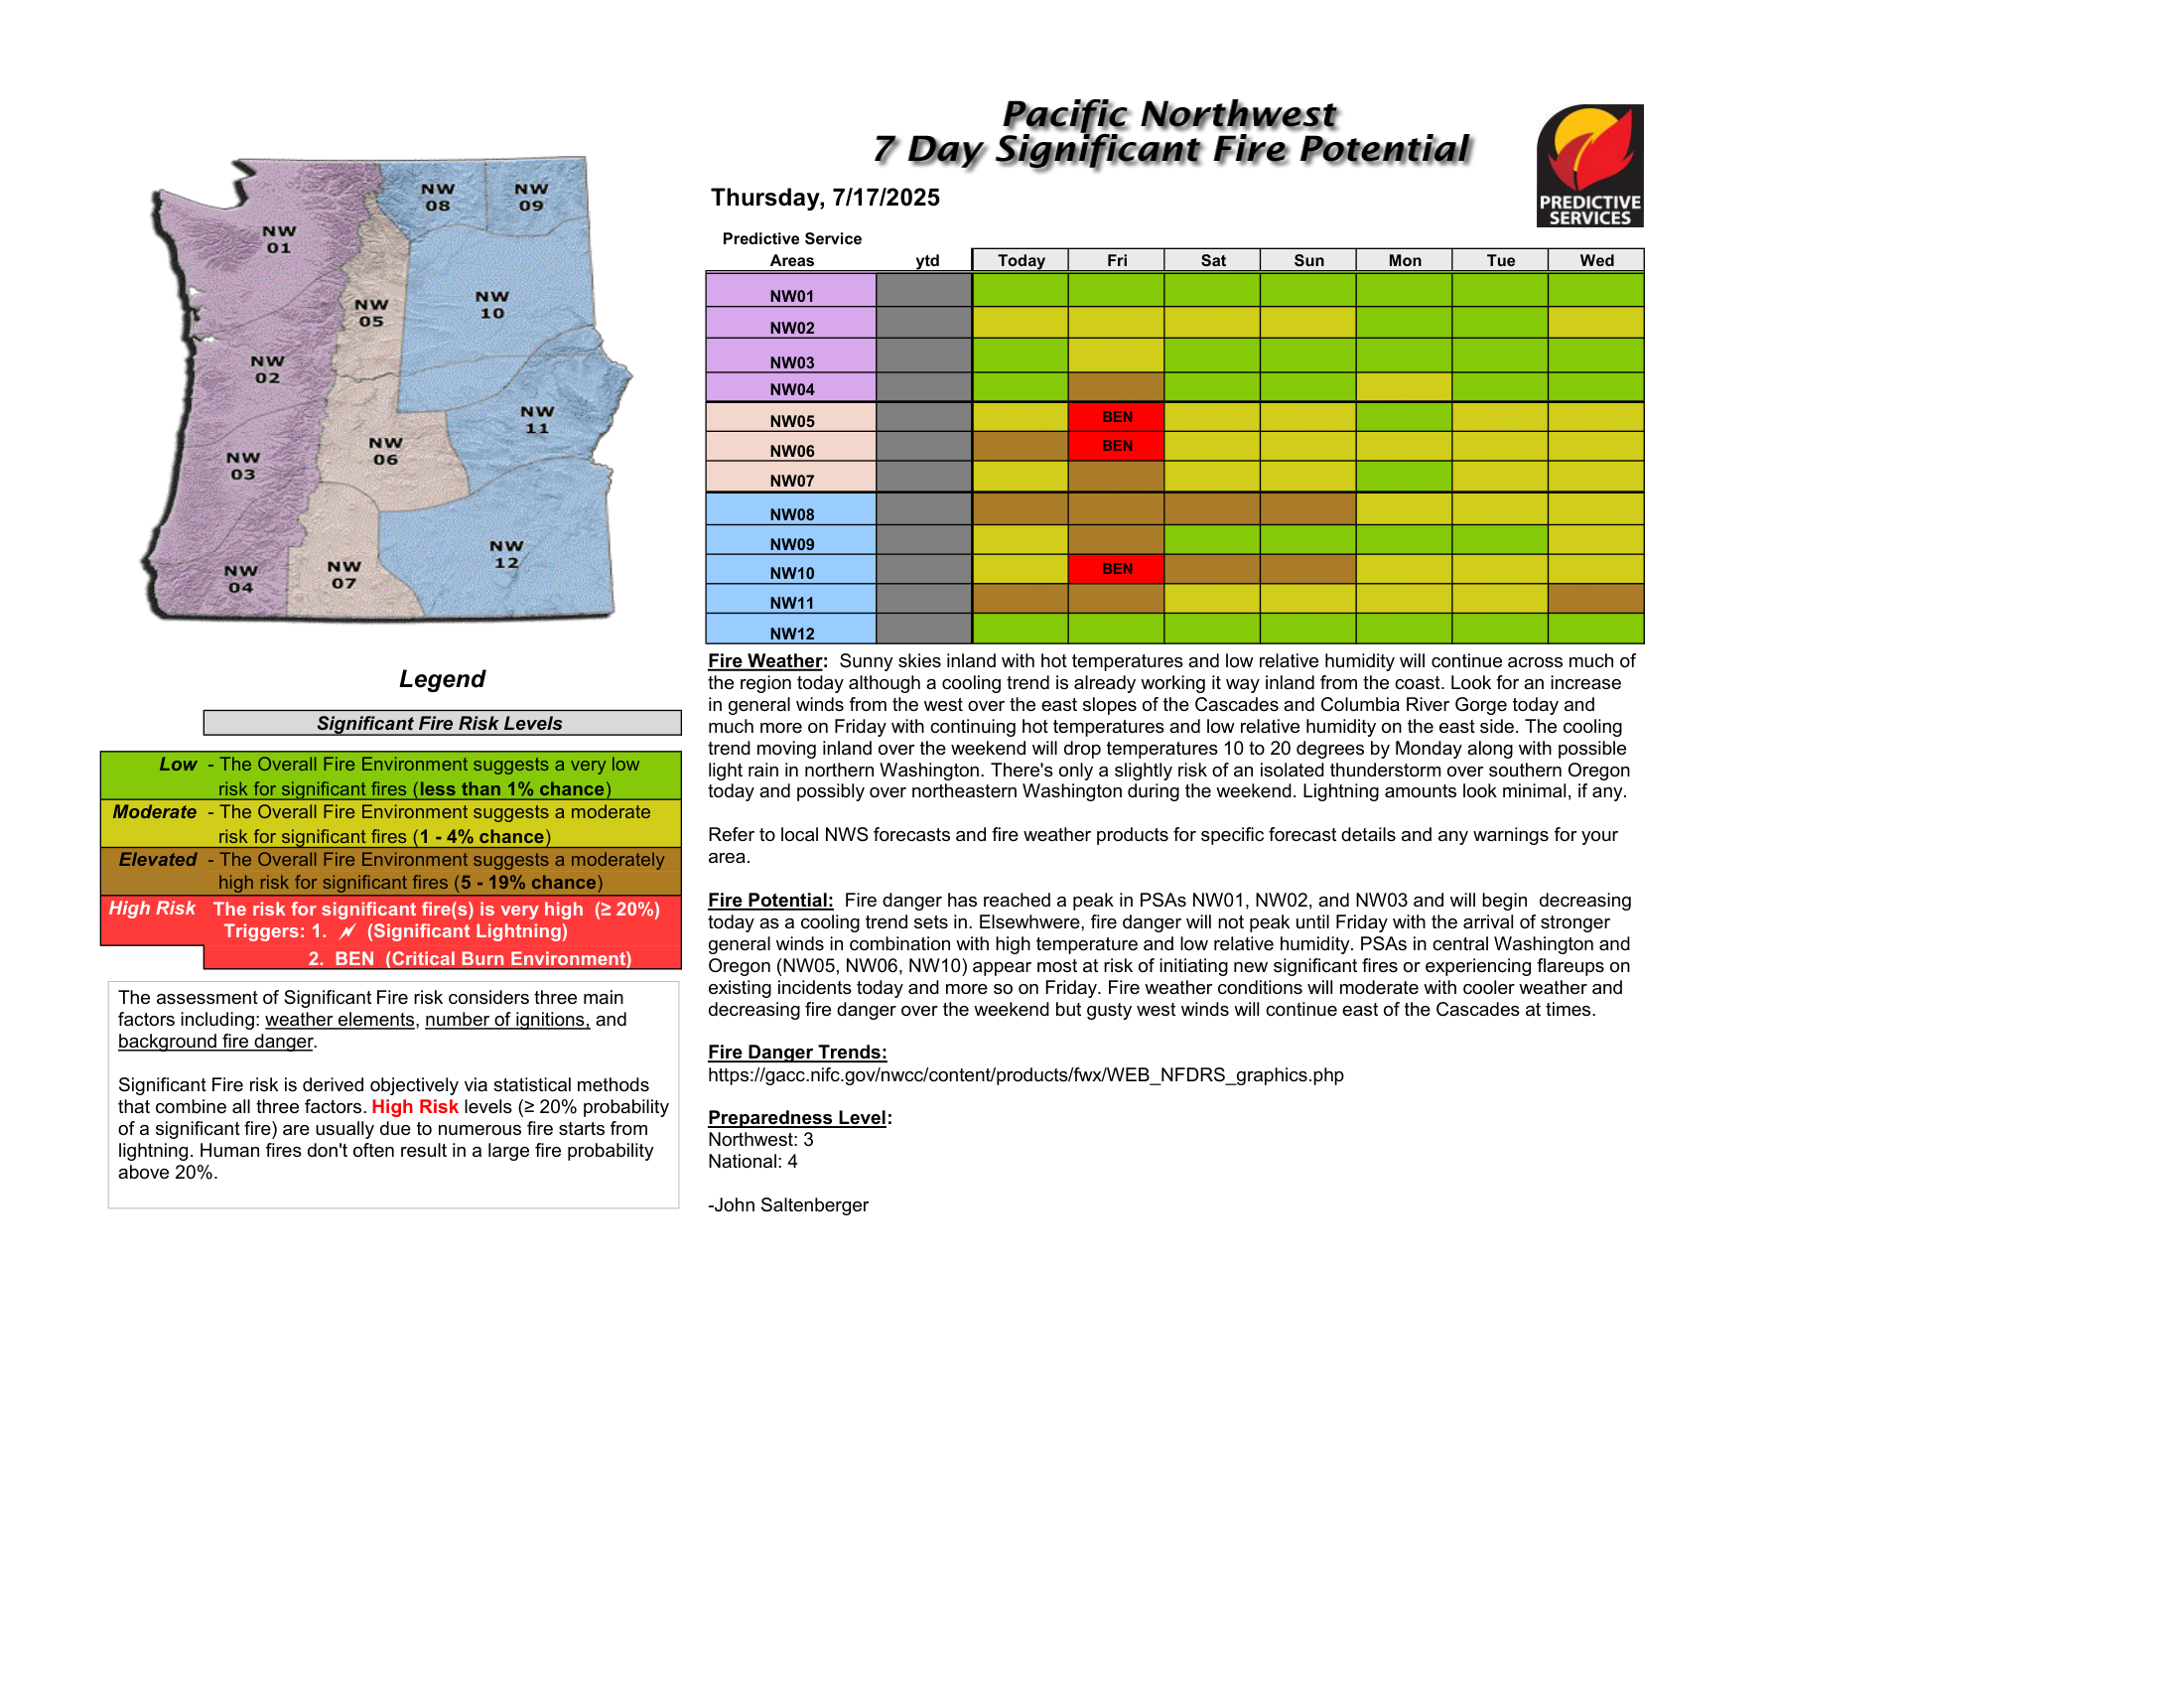
From the NWCC 7-Day outlook for PSAs NW06, NW07, NW10, NW12. 0 all green/yellow; 1 up to 25% brown; 2 up to 50% brown; 3 up to 75% brown; 4 over 75% brown with a high-risk event. Raise one level if a high-risk event (Hot-Dry-Unstable, Windy-Dry-Unstable, or Lightning) is present.
Sum to a Preparedness Level
Add the five scores. PL1 0–4, PL2 5–8, PL3 9–12, PL4 13–16, PL5 17–20.
USDM drought adjustment (2-week)
If any of the COFMS area is in D3 (Extreme) or D4 (Exceptional), the output equals the worksheet level. If below D3, the output is one level below.
Special-event bump (recommended, not automatic)
Raise one level for: Independence Day weekend (1–7 July); the general deer rifle season opener in October; a predicted dry cold-frontal passage with sustained winds over 25 mph and afternoon RH below 20%; a predicted lightning bust; or a Governor-declared emergency or large-attendance event in or near the area. Duty Officer discretion with Fire Management leadership.
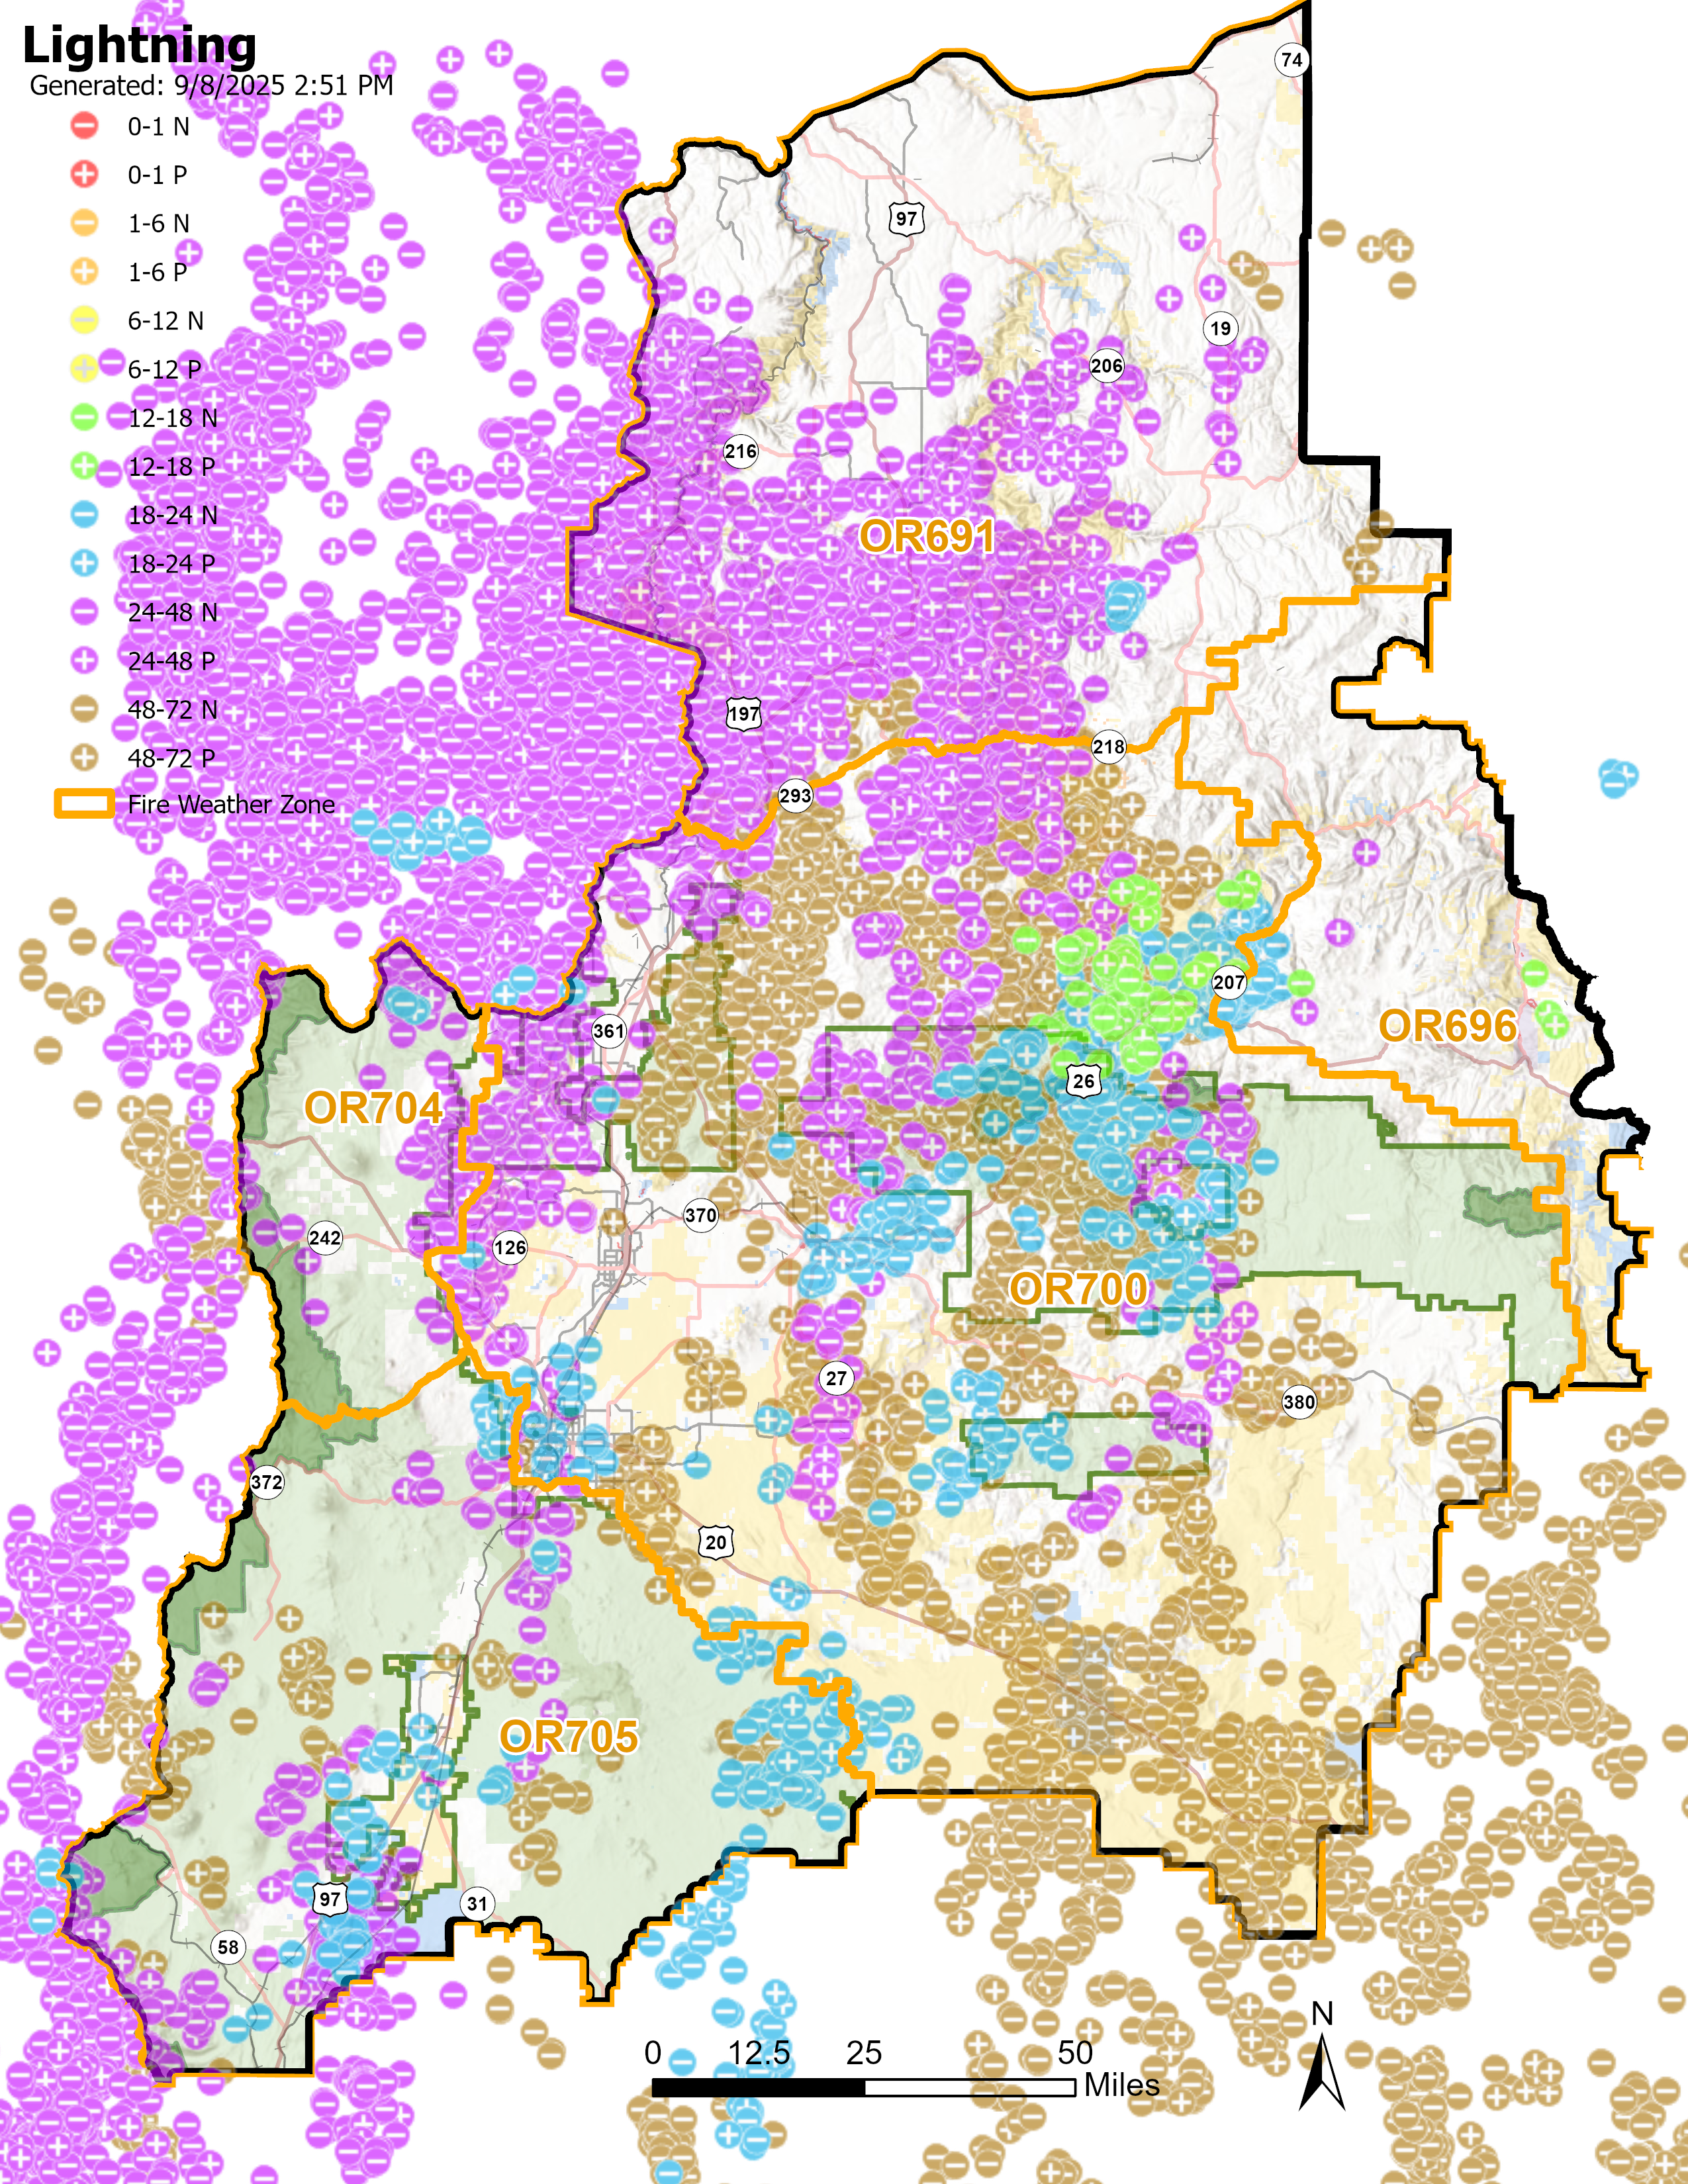
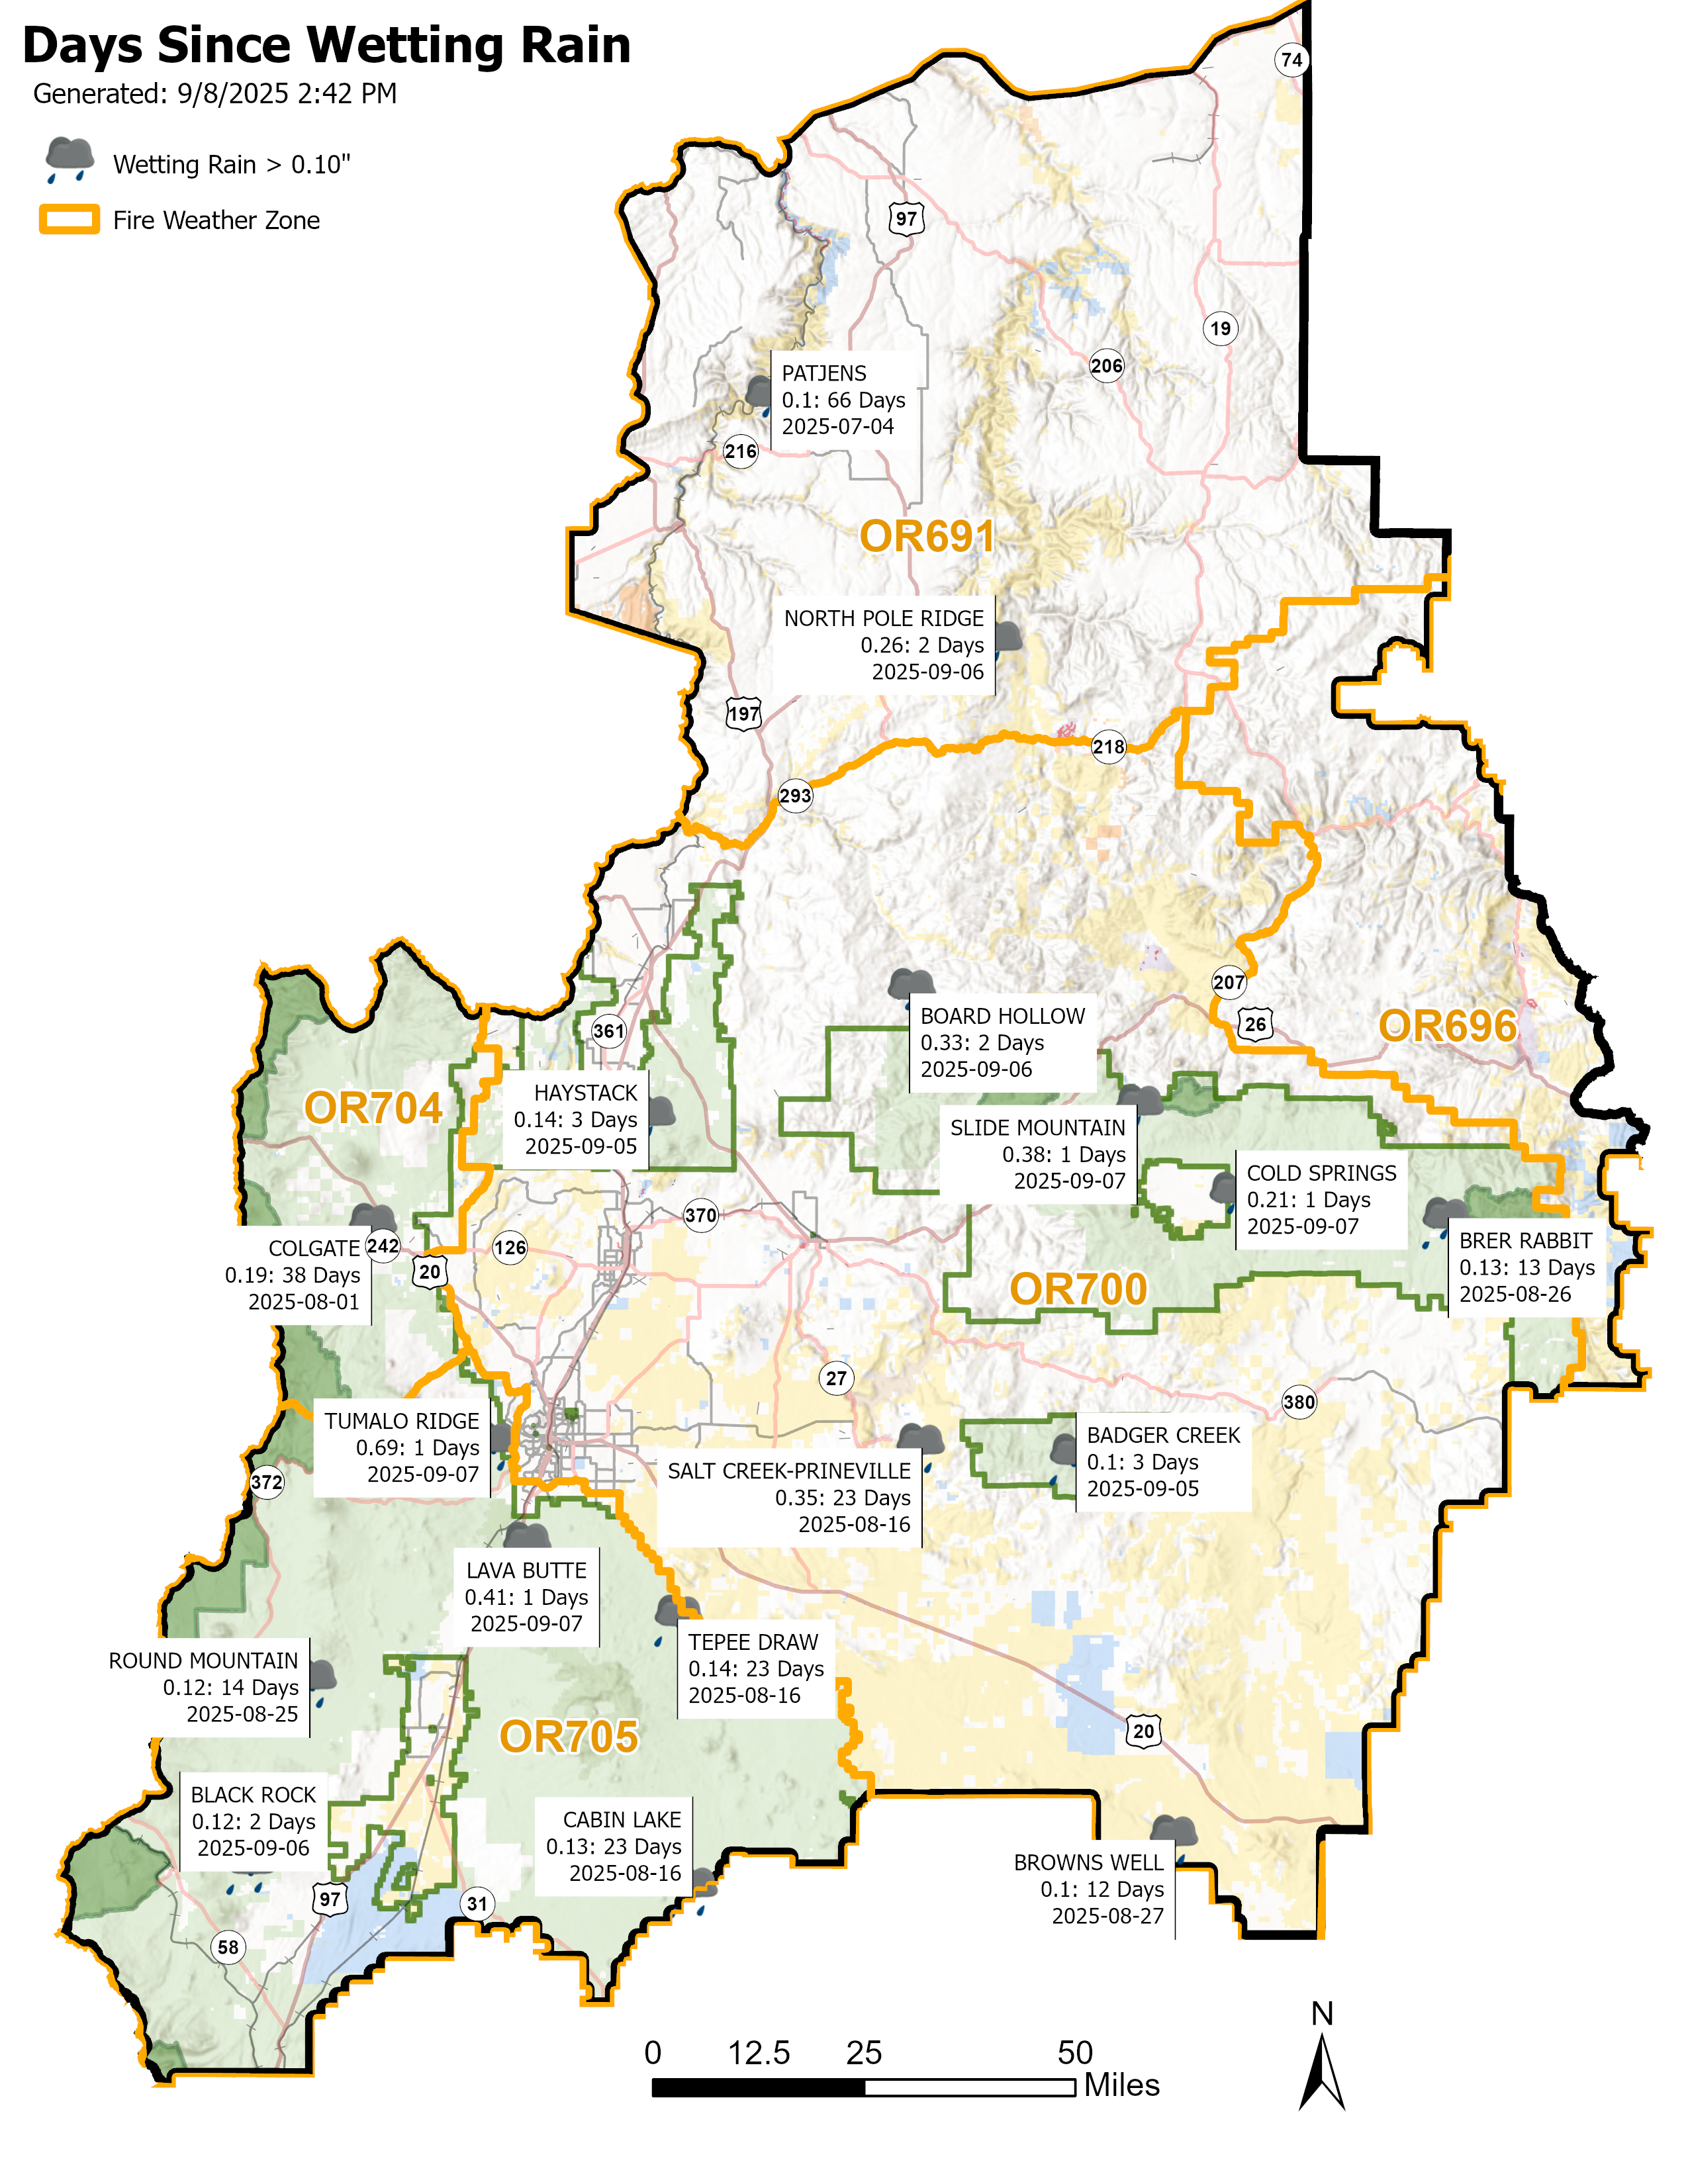
Recent Fire Risk
72-hour lightning activity and recent wetting rain across the COIDC RAWS network.
72-hour LightningWetting Rain
Fire Weather Matrices
Daily forecast by representative point, from NWS gridpoint data (the same gridded source as the NWS fire-weather point forecast). What the colors mean
Loading fire weather matrices…
Fire Weather Forecast
NWS Pendleton 7-day graphics plus Hot-Dry-Windy, pulled live from NWS and the Forest Service. All seven days show at once for the trend; switch to Single day to focus. Click any image for full size.
Climate Prediction Center, pulled live. Click for the full product.
TemperaturePrecipitation
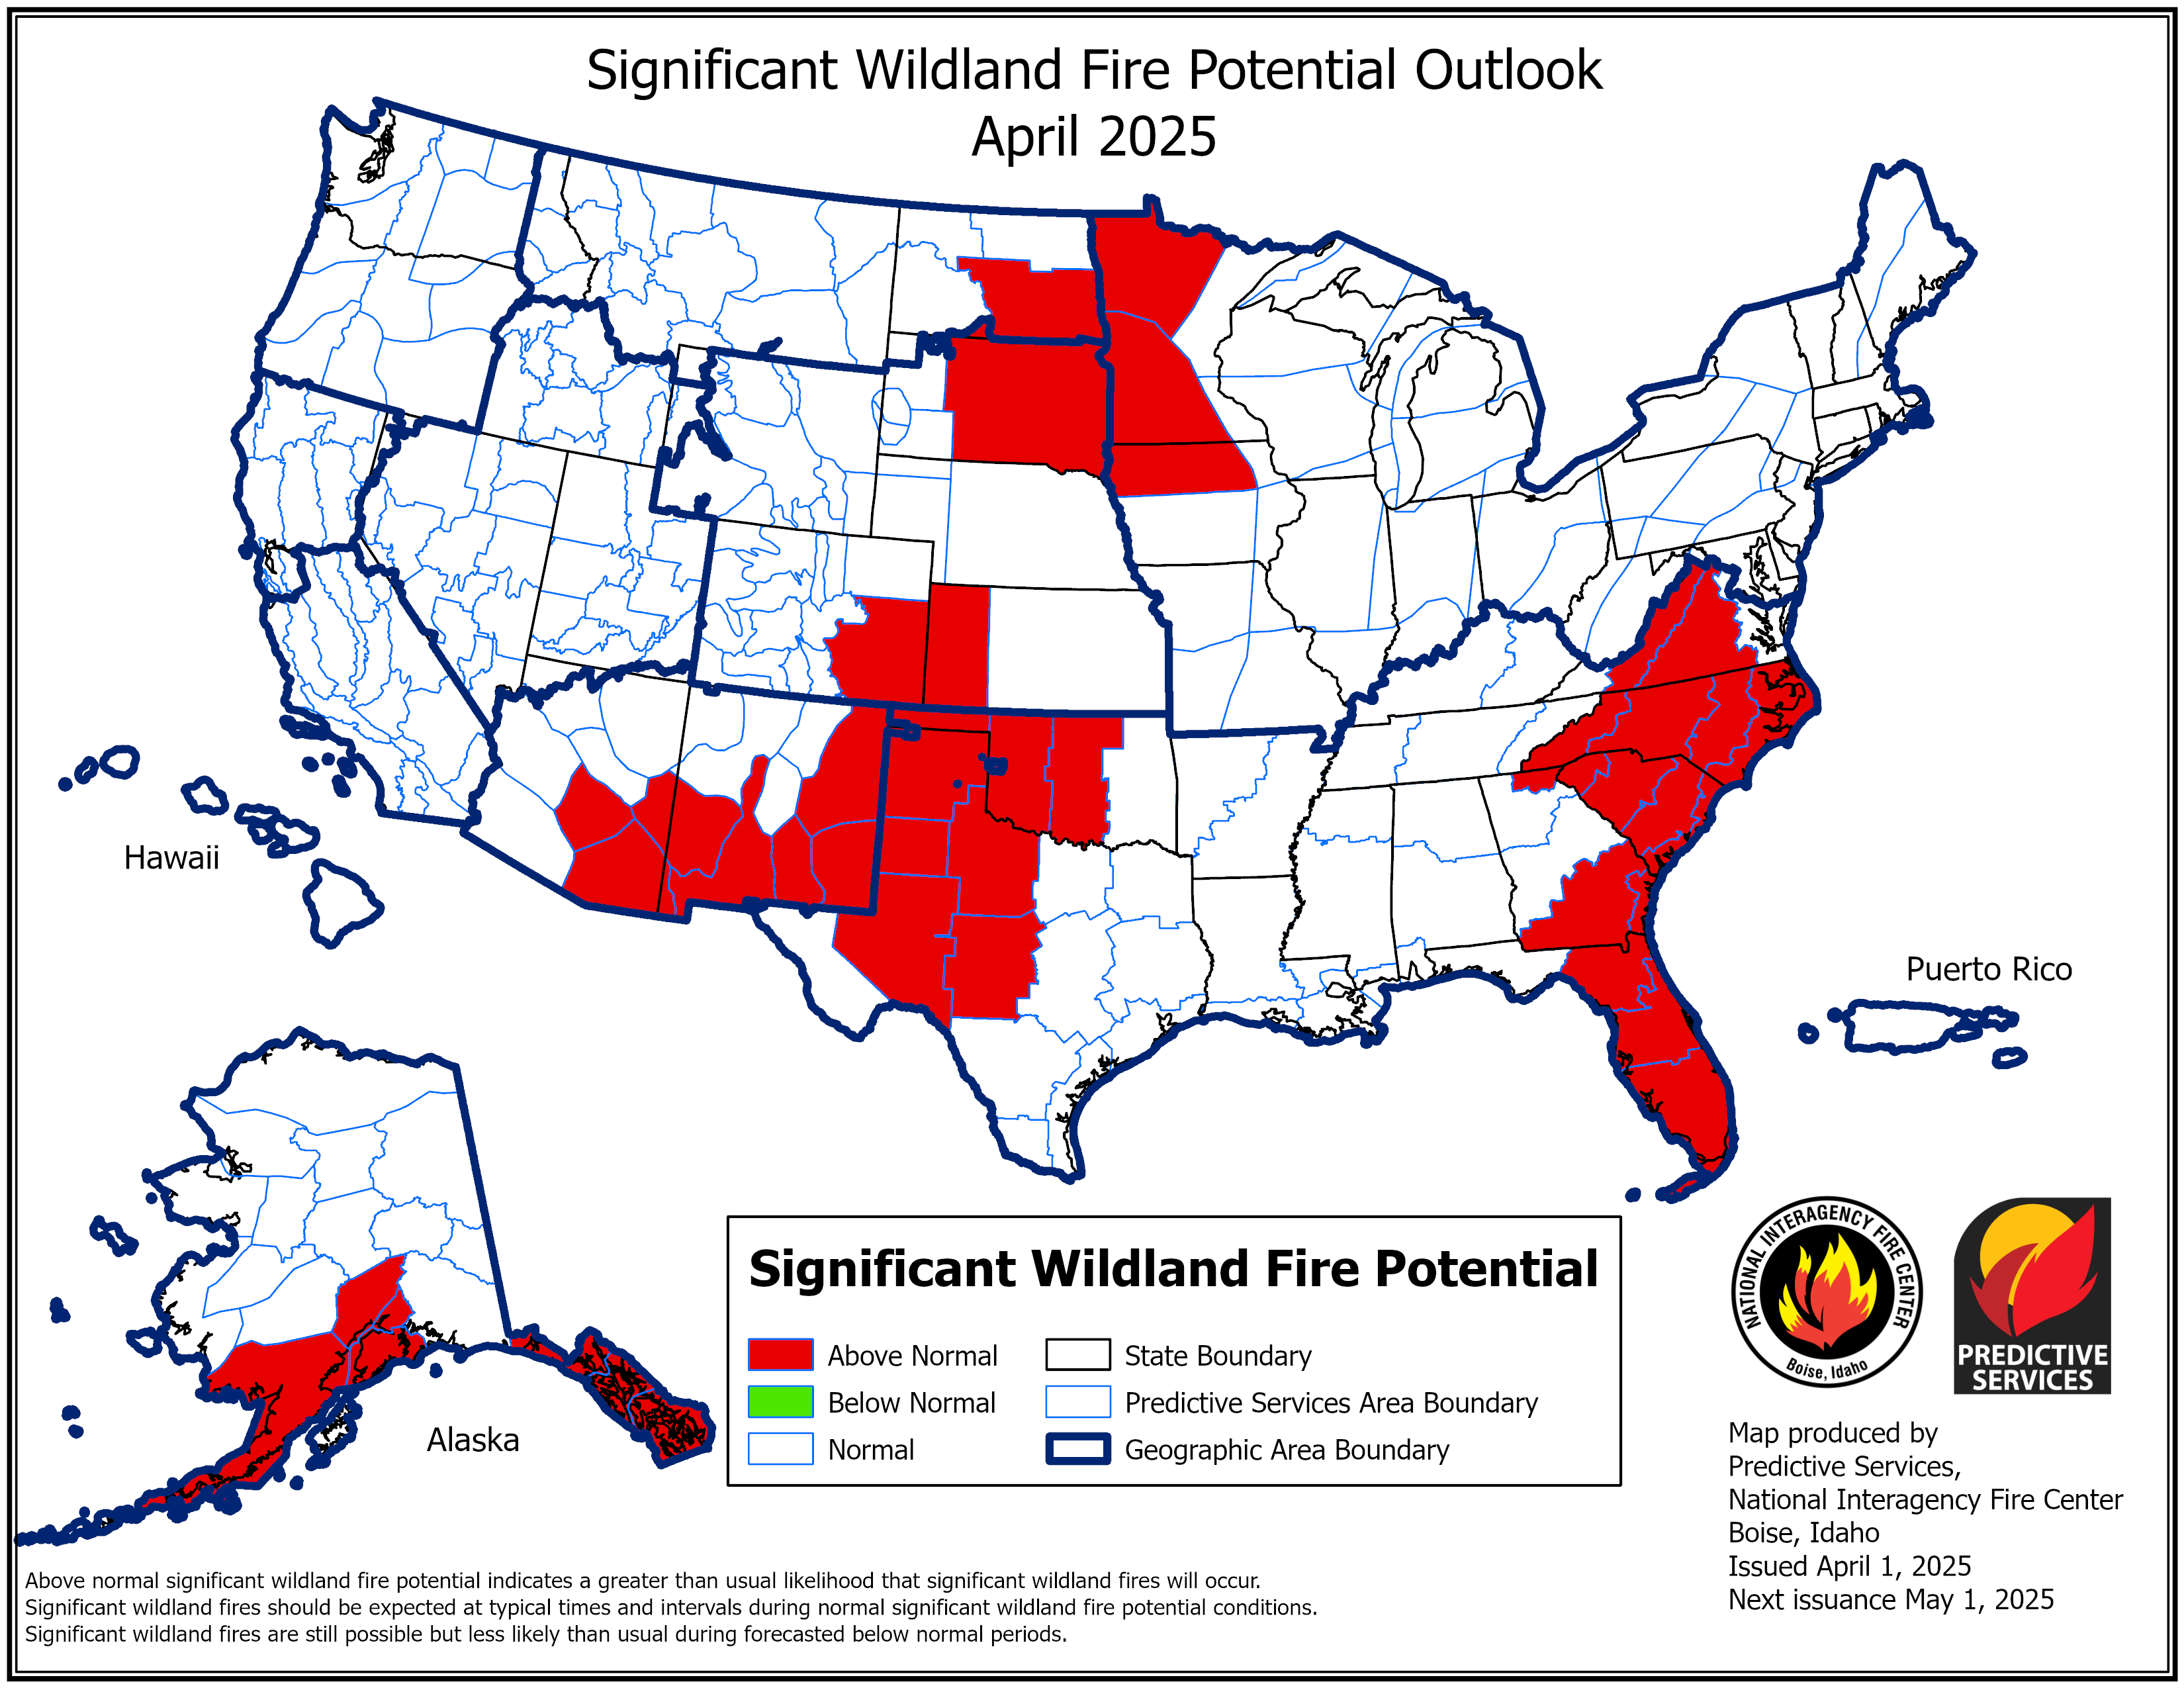
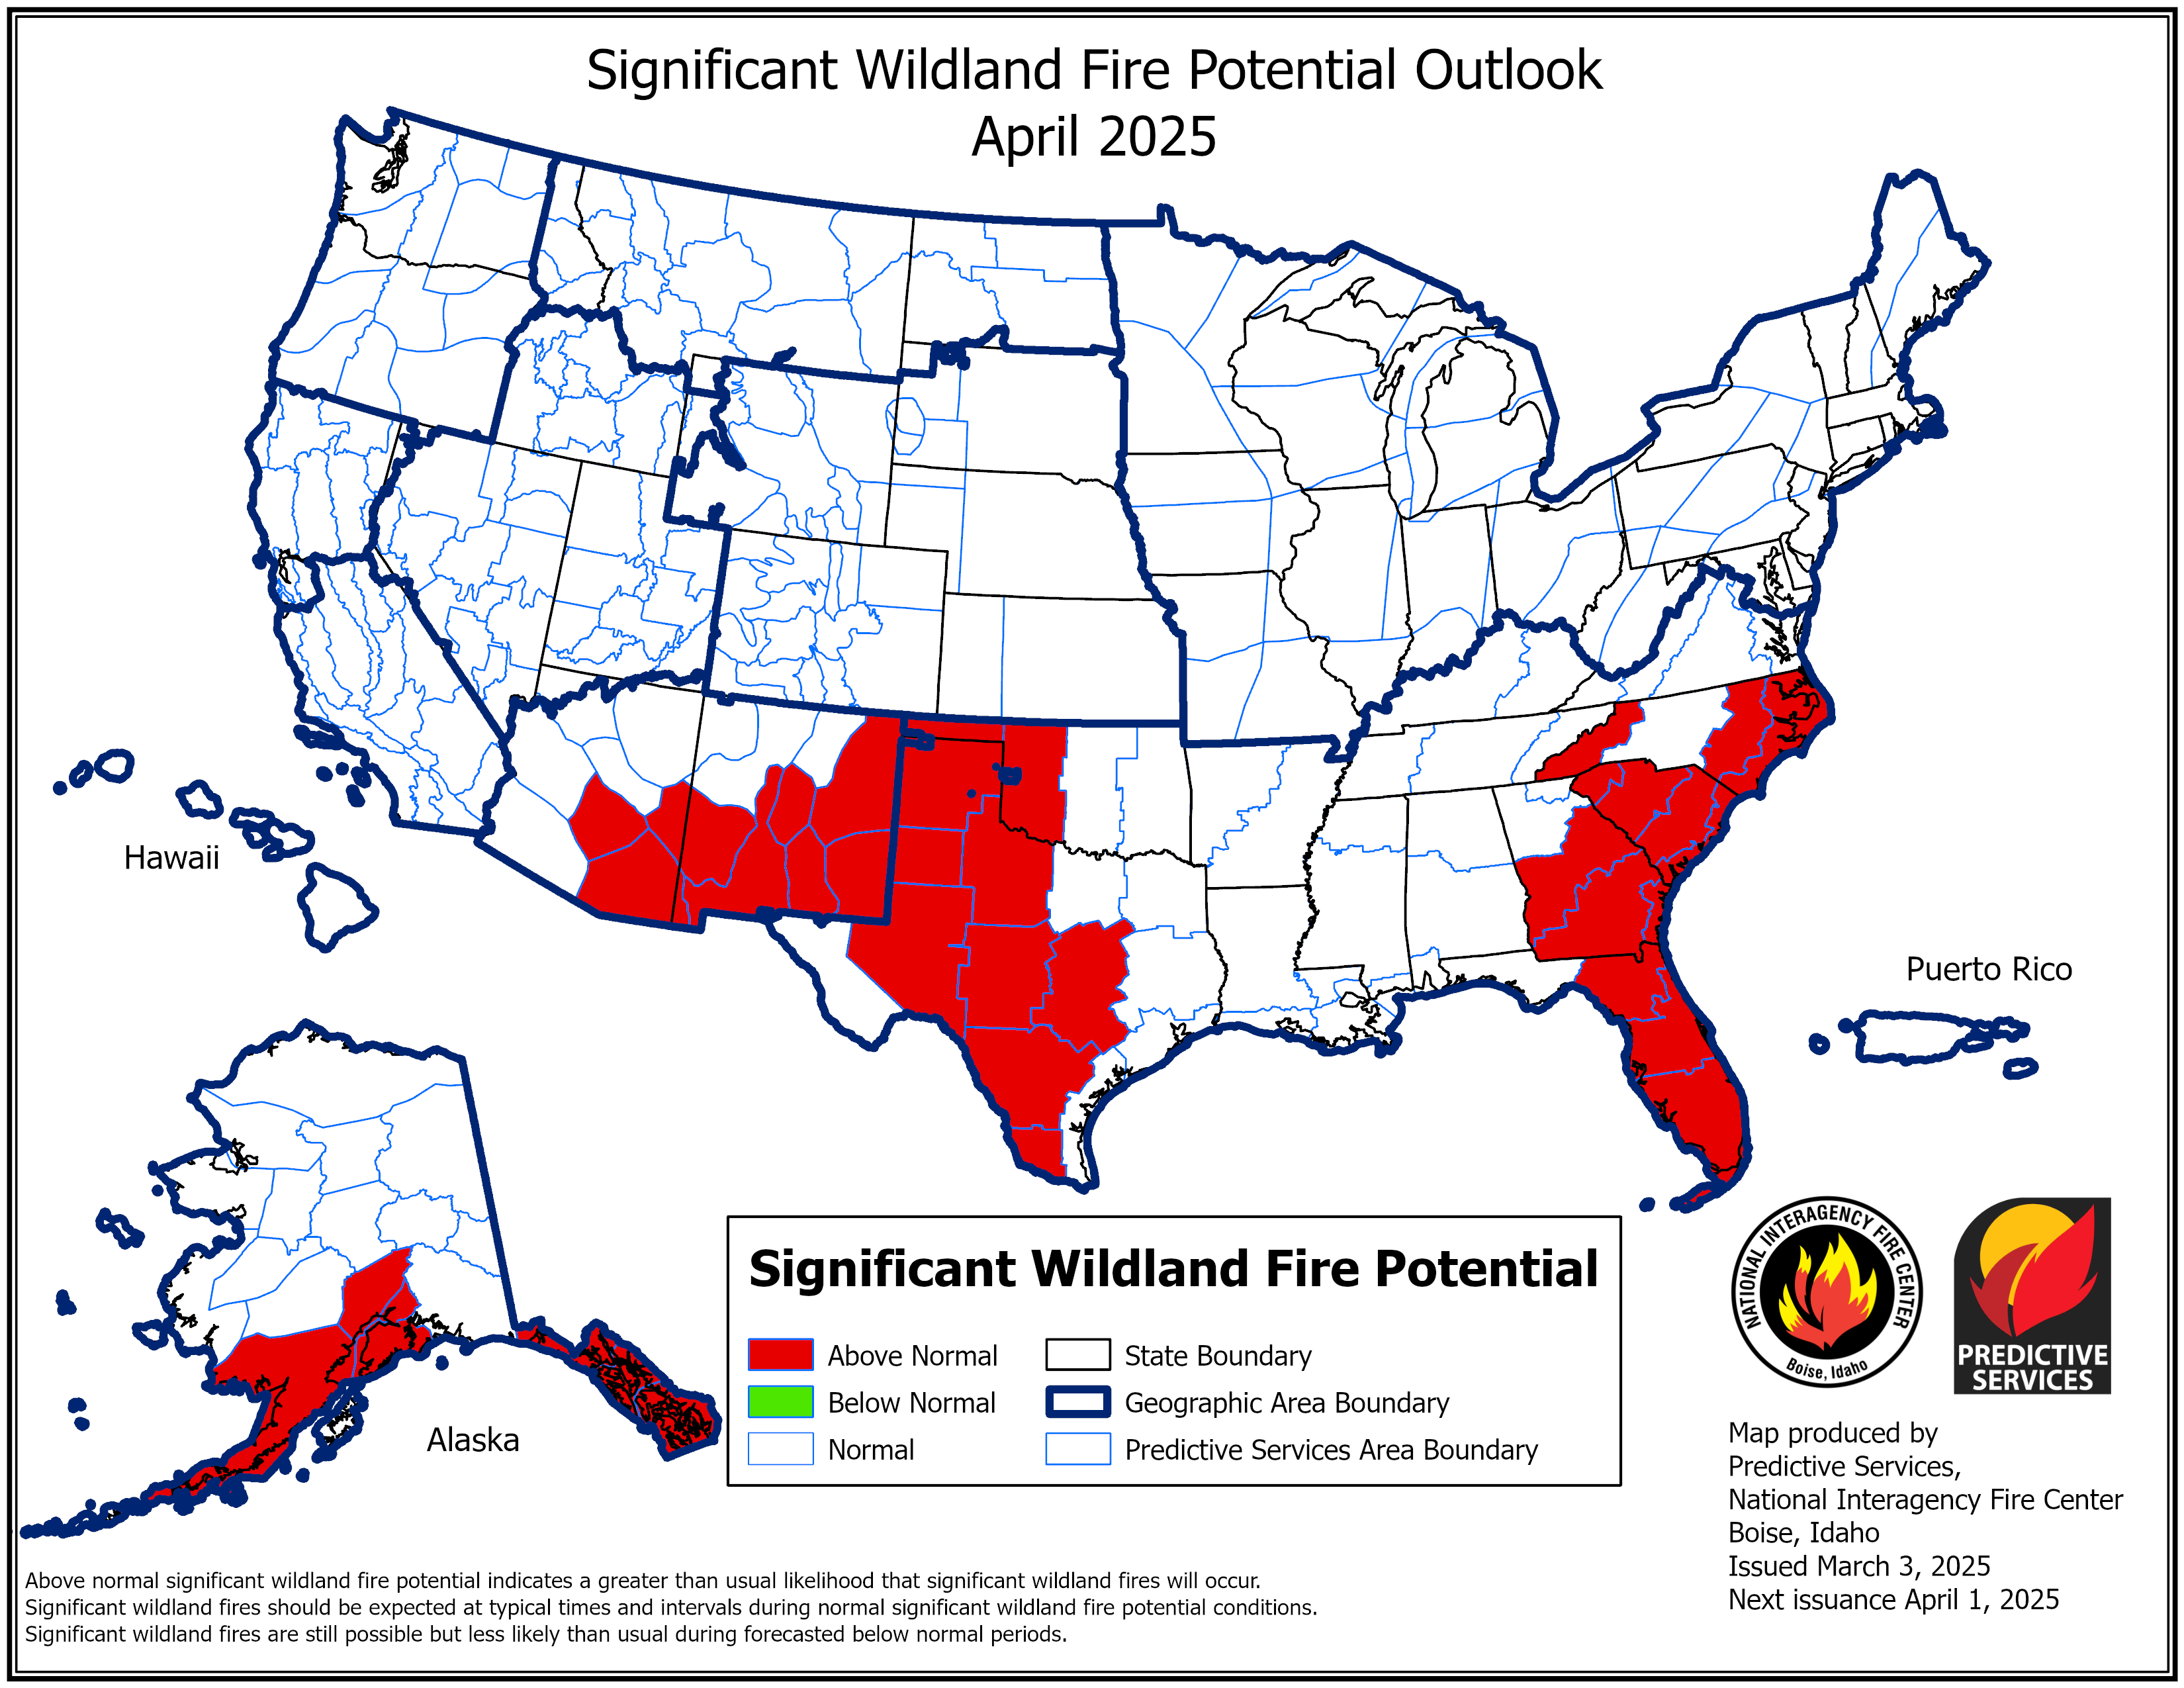
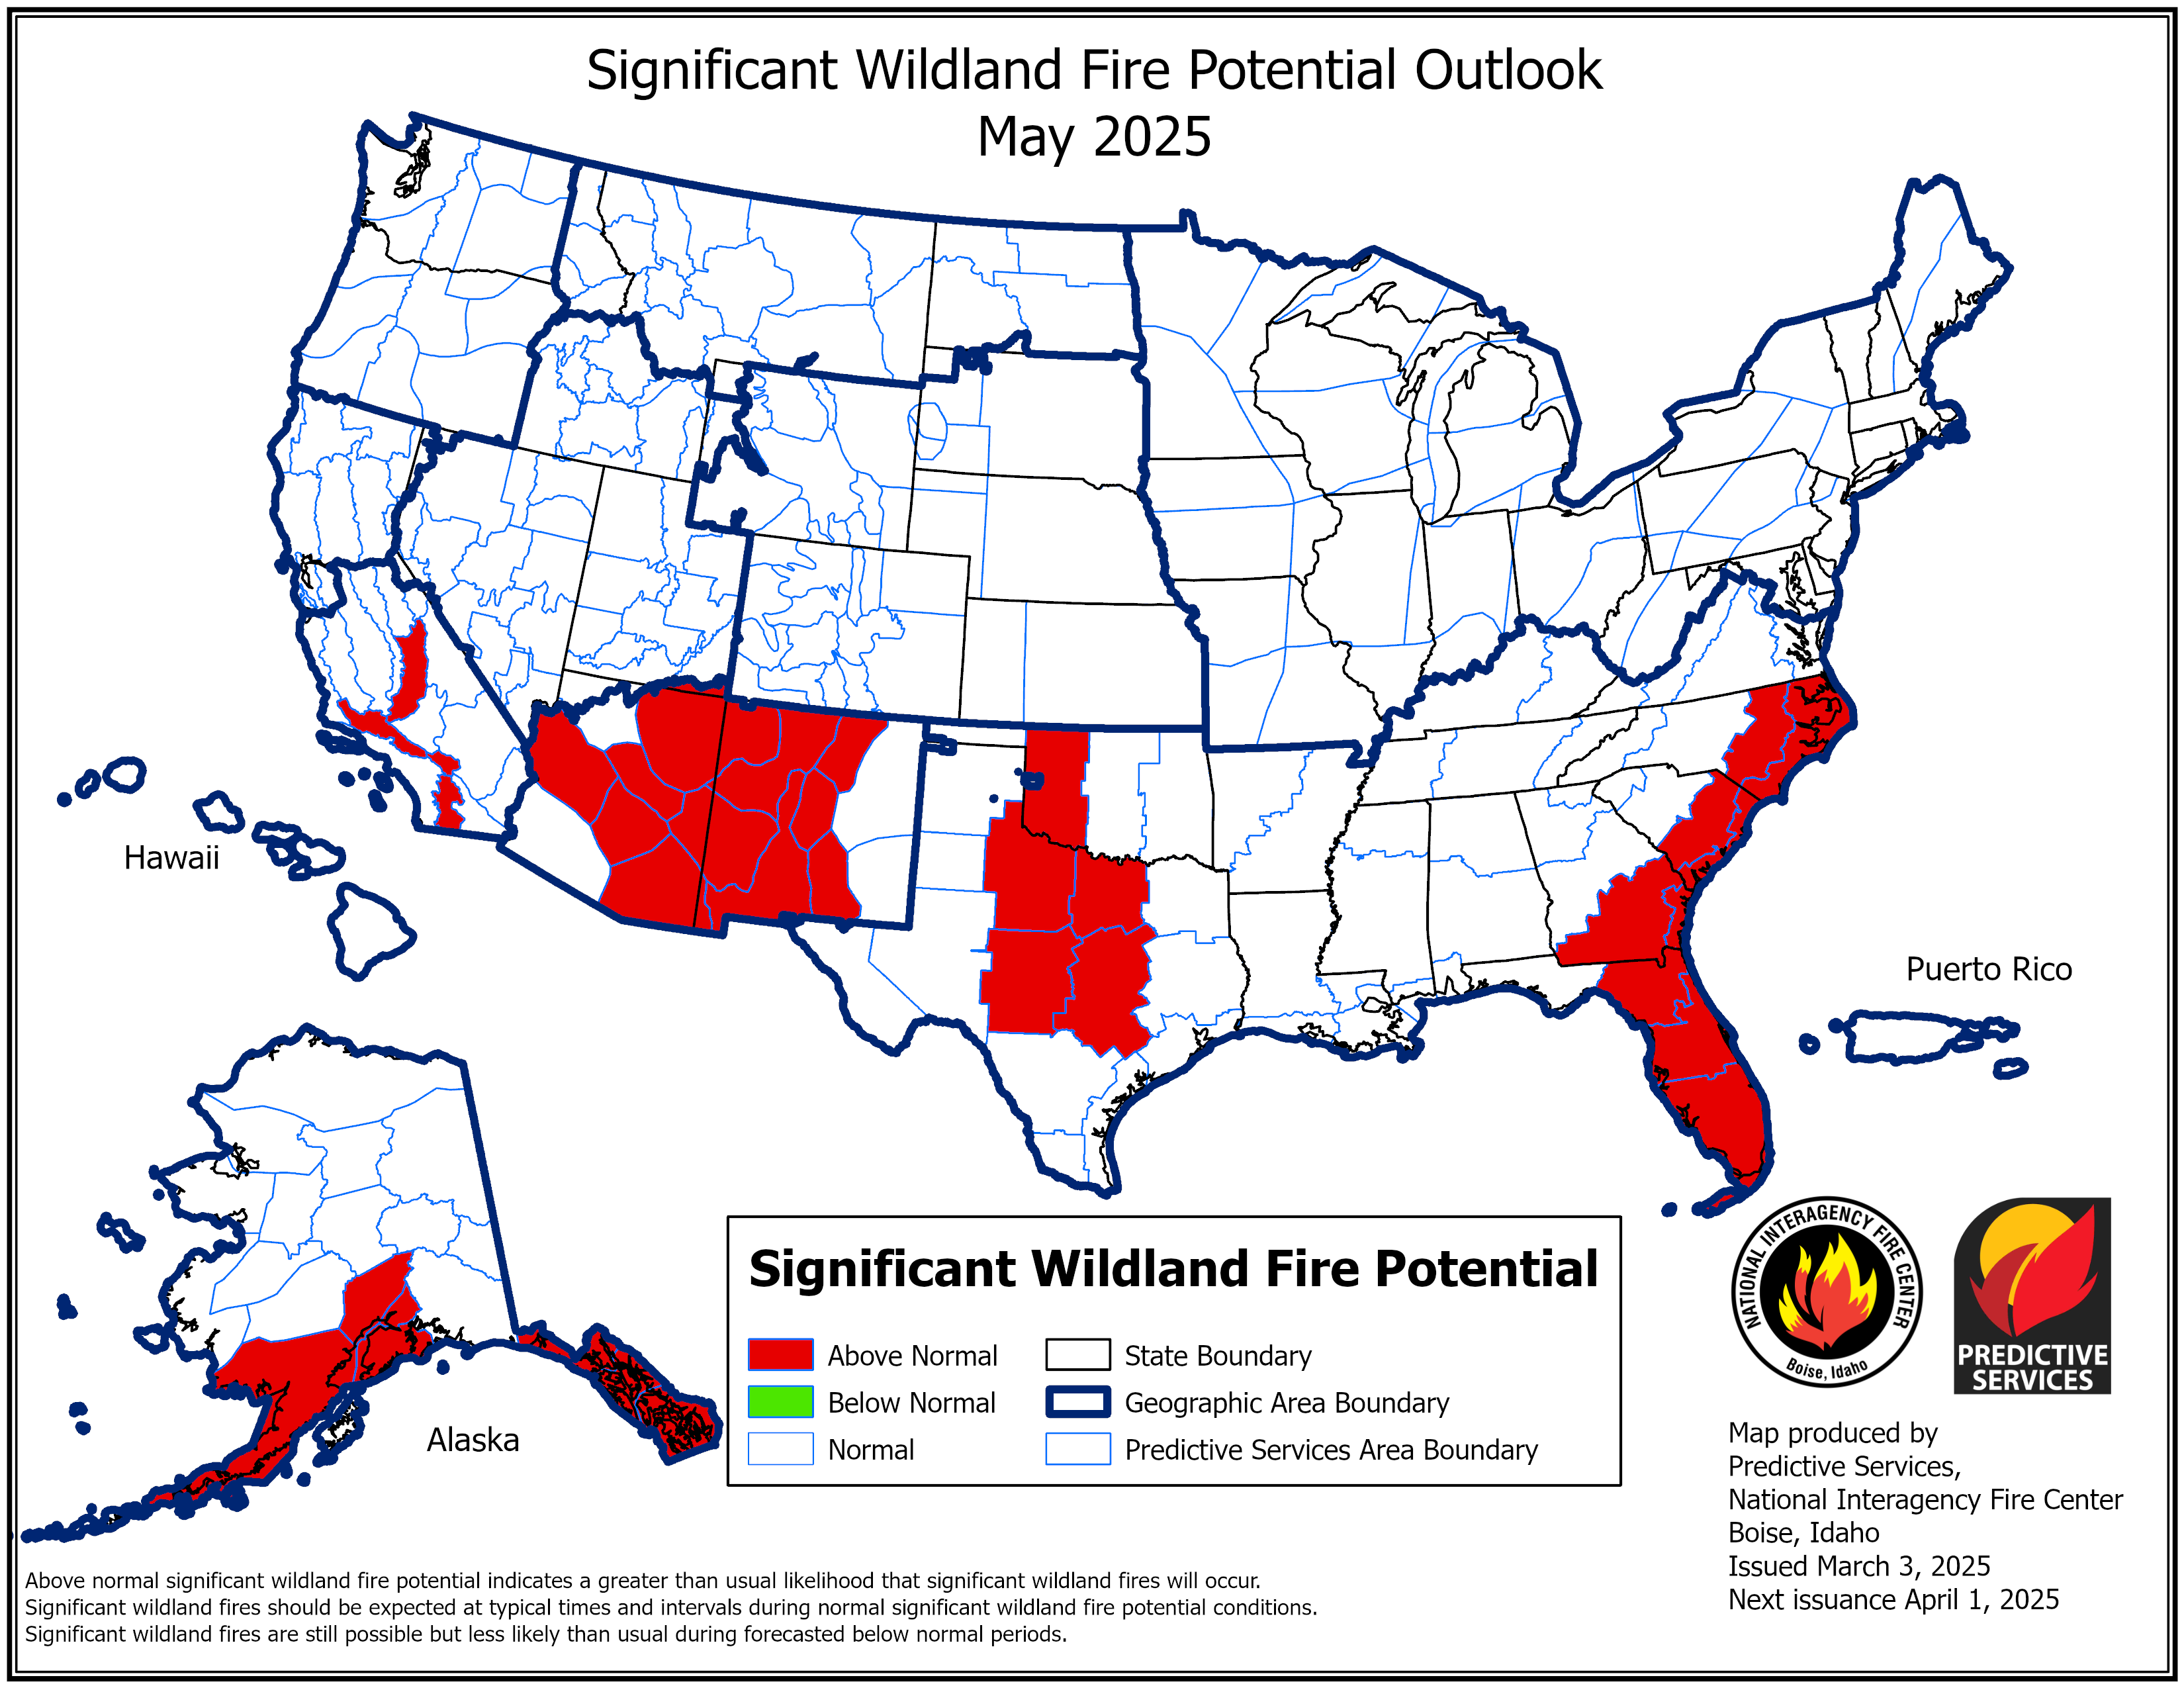
7-Day Significant Fire Potential
NWCC Predictive Services 7-day significant fire potential (PSAs NW06, NW07, NW10, NW12) and the 10-day predicted ERC / 100-hr trend. Use these to set the 7-Day Fire Potential input in the Local PL worksheet.
7-Day Significant Fire Potential10-Day ERC & 100-hr Trend
Each Fire Danger Rating Area has its own class breaks, set from the climatology so a class means the same thing everywhere. Use these to read a number behind an adjective. ERC drives the Fire Danger Level, BI drives the run-card Response Level, and SFDI drives the Staffing Level.
ERC → Fire Danger Level (Energy Release Component)
Class
East Slope
Monument
Columbia Plateau
High Desert
Ochoco-Maury
John Day Basin
Low
0–25
0–24
0–28
0–31
0–25
0–26
Moderate
26–30
25–34
29–38
32–38
26–34
27–39
High
31–39
35–44
39–50
39–47
35–47
40–51
Extreme
40+
45+
51+
48+
48+
52+
The PL worksheet's 5-Day ERC input does not use these per-FDRA breaks. It scores the 5-day average against unit-wide ERC cuts: 0 0–27 · 1 28–41 · 2 42–50 · 3 51–57 · 4 58+.
BI → Response Level (Burning Index, run-card color)
Class
East Slope
Monument
Columbia Plateau
High Desert
Ochoco-Maury
John Day Basin
RL1 Blue
0–15
0–16
0–21
0–20
0–19
0–21
RL2 Yellow
16–23
17–23
22–27
21–27
20–26
22–27
RL3 Red
24+
24+
28+
28+
27+
28+
SFDI → Staffing Index (Staffing Fire Danger Index)
Class
East Slope
Monument
Columbia Plateau
High Desert
Ochoco-Maury
John Day Basin
1 Low
0–51
0–45
0–45
0–49
0–49
0–50
2 Moderate
52–62
46–60
46–62
50–63
50–61
51–66
3 High
63–75
61–74
63–75
64–77
62–74
67–78
4 Very High
76–90
75–87
76–88
78–90
75–87
79–90
5 Extreme
91+
88+
89+
91+
88+
91+
Staffing Level then shifts off the SFDI index: with no Red Flag Warning it drops one level (floored at 1); with a Red Flag in effect Staffing Level is increased by 1.
Fire Weather Matrix — color thresholds
Daily values from the NWS gridpoint forecast. Temp, RH, Wind, and Gust use fire-weather thresholds (green calm to red critical). Precip and sky are tinted by amount. Ventilation Index shows as a category.
Max Temp °F
<70 70–79 80–89 90–99 100+
Min RH %
≥40 30–39 20–29 15–19 <15
Wind mph
<10 10–19 20–24 25–34 35+
Gust mph
<15 15–27 28–34 35–44 45+
Chance of Precip % · QPF in
Tinted by amount, wetter is favorable. Precip: ≥10 ≥30 ≥60. QPF: ≥0.01 ≥0.10 ≥0.25 in.
Sky %
25–49 50–74 75+ cloud cover.
Ventilation Index = transport wind (kts) × mixing height (ft) ÷ 100
Low <200 Moderate 200–499 (good Rx-burn window) High 500–699 Very High 700+ (large fire-growth potential)