88% of Normal to Date
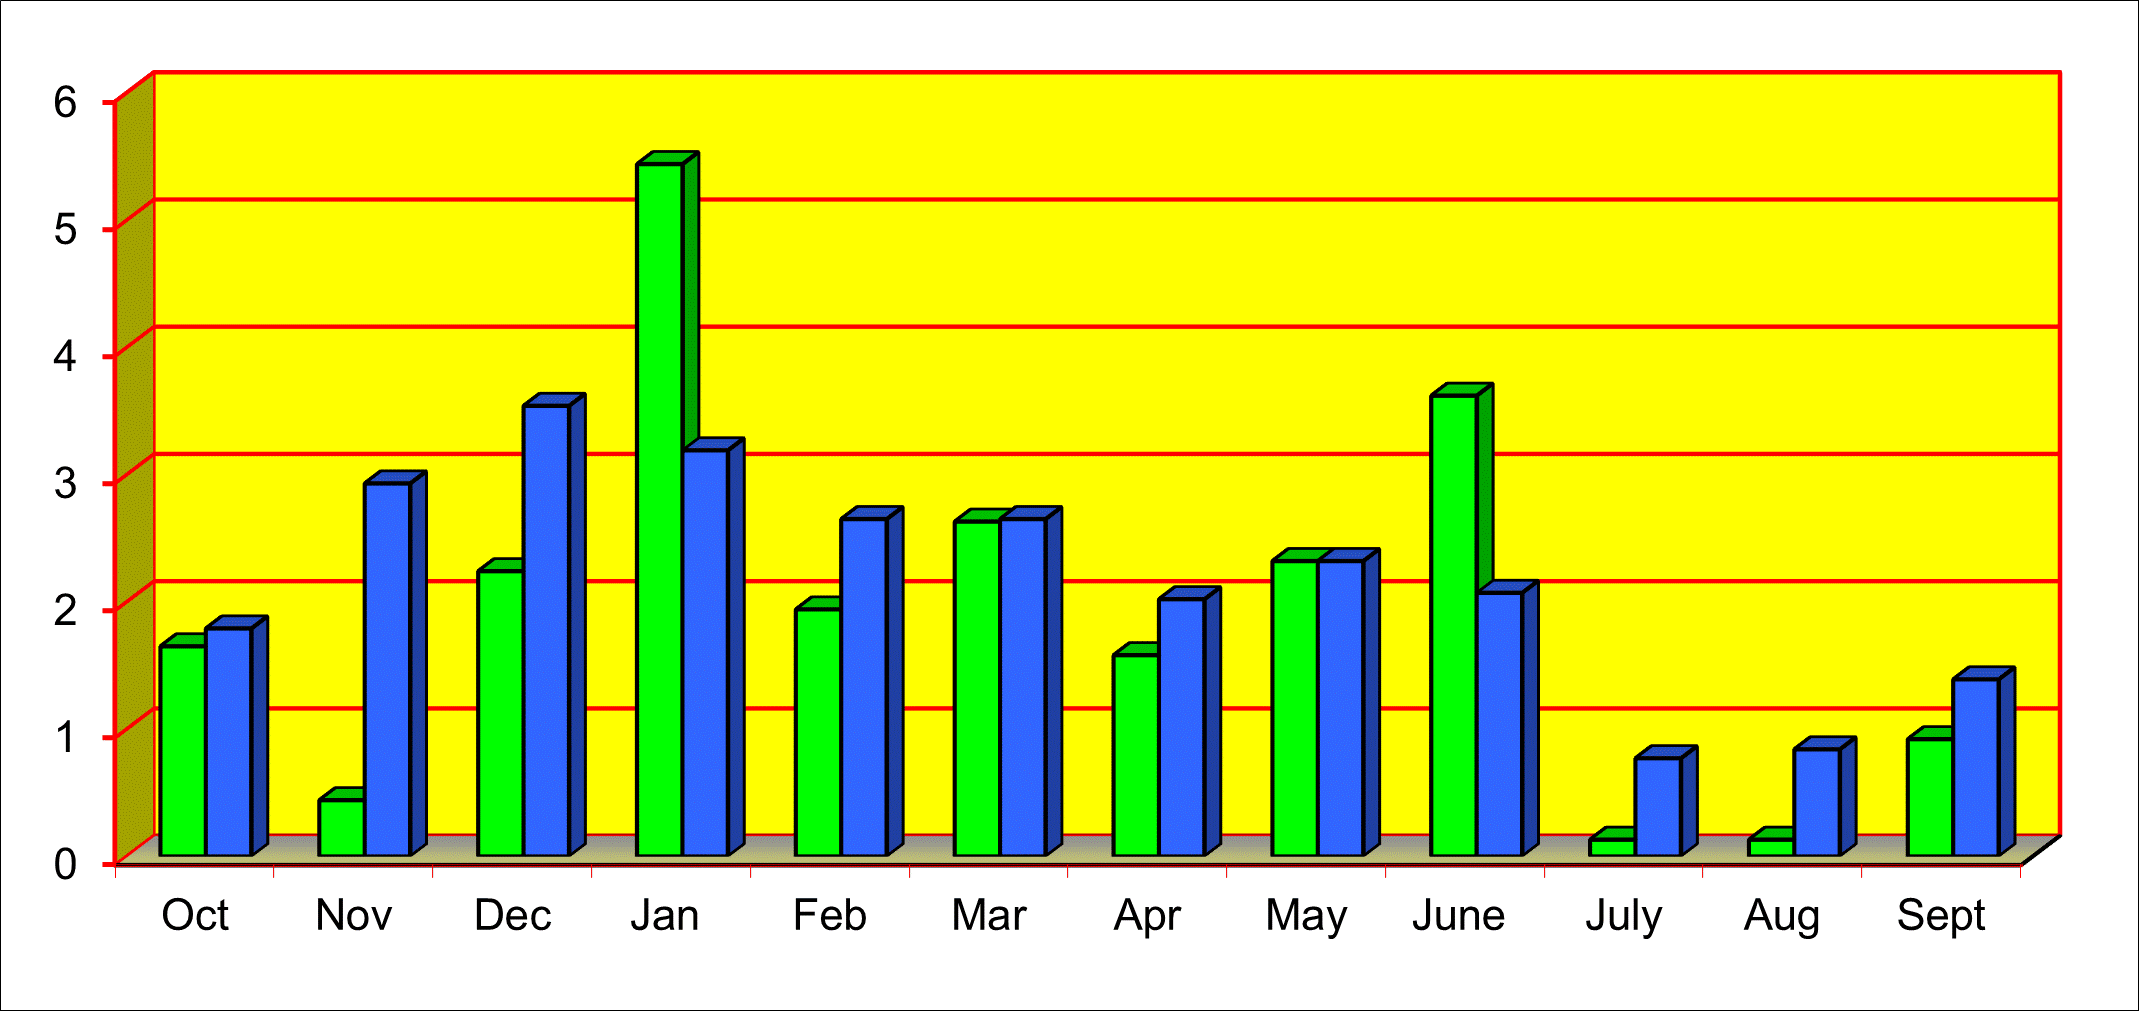
| Oct | Nov | Dec | Jan | Feb | Mar | Apr | May | June | July | Aug | Sept | Total | |
| 2019/2020 | 1.65 | 0.44 | 2.24 | 5.44 | 1.94 | 2.63 | 1.58 | 2.32 | 3.62 | 0.13 | 0.13 | 0.92 | 23.04 |
| 50-Year Avg | 1.79 | 2.93 | 3.54 | 3.19 | 2.65 | 2.65 | 2.02 | 2.32 | 2.07 | 0.77 | 0.84 | 1.39 | 26.16 |
| Difference | 0.14 | 2.49 | 1.30 | 2.25 | 0.71 | 0.02 | 0.44 | 0.00 | 1.55 | 0.64 | 0.71 | 0.46 | |
| Cumulative | 0.14 | 2.63 | 3.97 | 1.72 | 2.43 | 2.45 | 2.89 | 2.89 | 1.34 | 1.98 | 2.69 | 3.16 | |
| % by Month | 92% | 15% | 63% | 171% | 73% | 99% | 78% | 100% | 175% | 17% | 15% | 66% | 88% |