
ENERGY RELEASE COMPONENT (ERC)
1. 2-DAY MOVING AVERAGE ERC CHARTS - BY PREDICTIVE SERVICES AREA (PSA)
Click on Predictive Services Area to view the latest ERC Chart.
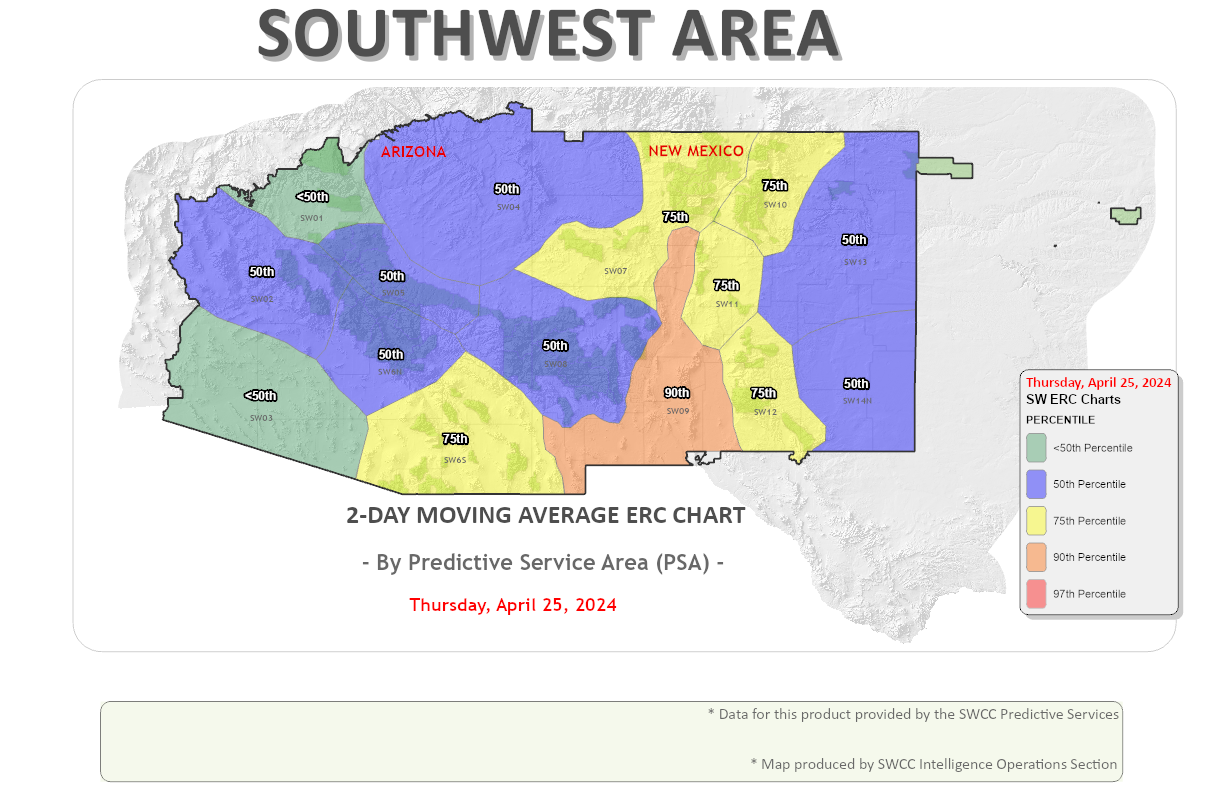
2-Day Moving Average ERC Charts - By PSA All ERC Percentile values
2014 - 2023 ERC Percentile Breakpoints
| PSA | 50th | 60th | 70th | 75th | 80th | 85th | 90th | 95th | 97th |
|---|---|---|---|---|---|---|---|---|---|
| SW01 | 30 | 36 | 42 | 45 | 48 | 53 | 58 | 65 | 67 |
| SW02 | 46 | 51 | 56 | 59 | 62 | 66 | 70 | 75 | 78 |
| SW03 | 66 | 70 | 74 | 76 | 79 | 82 | 86 | 90 | 92 |
| SW04 | 30 | 35 | 41 | 44 | 47 | 50 | 54 | 62 | 64 |
| SW05 | 29 | 34 | 40 | 43 | 46 | 49 | 53 | 60 | 64 |
| SW06N | 50 | 56 | 62 | 66 | 70 | 74 | 80 | 86 | 88 |
| SW06S | 42 | 48 | 54 | 56 | 60 | 63 | 68 | 75 | 78 |
| SW07 | 31 | 36 | 41 | 43 | 45 | 49 | 53 | 60 | 63 |
| SW08 | 32 | 36 | 41 | 43 | 47 | 49 | 54 | 61 | 64 |
| SW09 | 46 | 51 | 55 | 58 | 61 | 64 | 68 | 73 | 77 |
| SW10 | 26 | 30 | 33 | 35 | 38 | 40 | 44 | 48 | 51 |
| SW11 | 39 | 43 | 47 | 50 | 52 | 55 | 59 | 64 | 67 |
| SW12 | 33 | 36 | 40 | 43 | 45 | 47 | 51 | 55 | 58 |
| SW13 | 37 | 40 | 44 | 46 | 48 | 50 | 53 | 58 | 60 |
| SW14N | 42 | 46 | 50 | 51 | 53 | 56 | 60 | 66 | 68 |
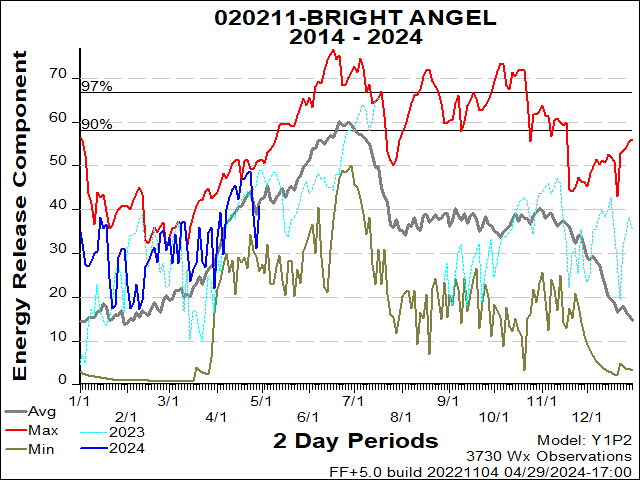
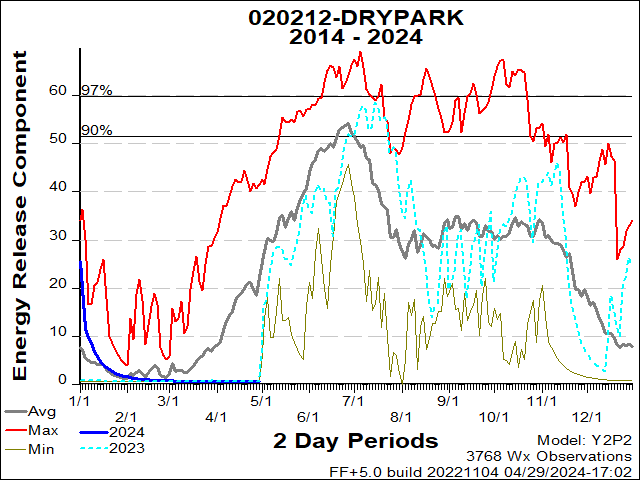
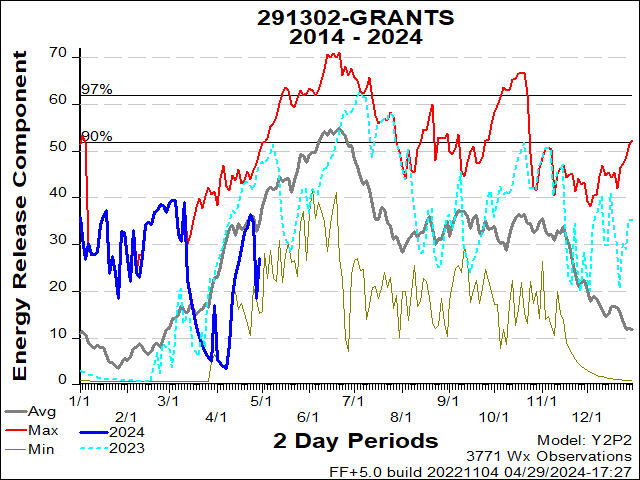
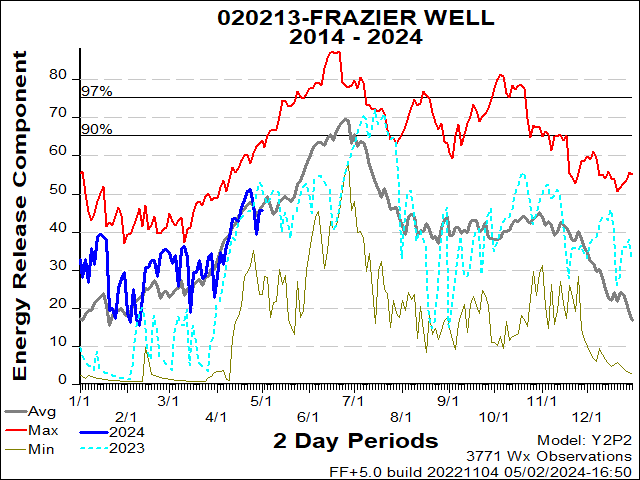
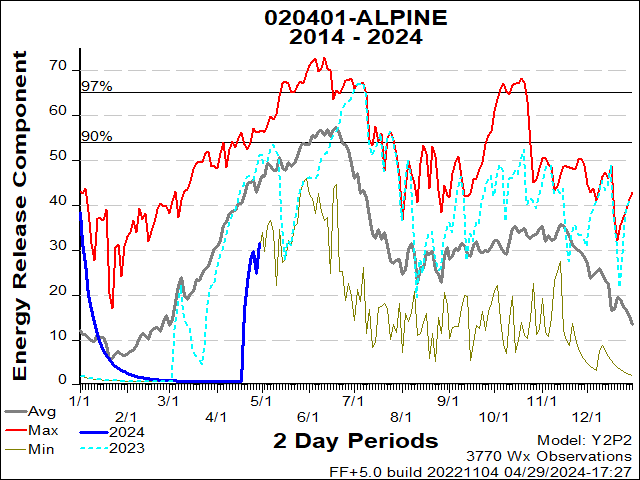
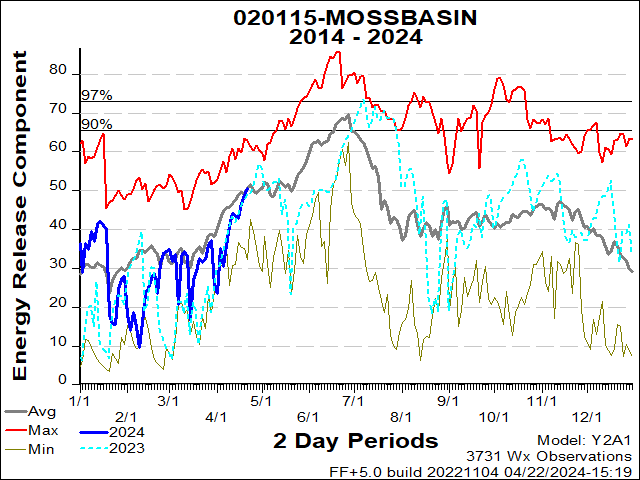
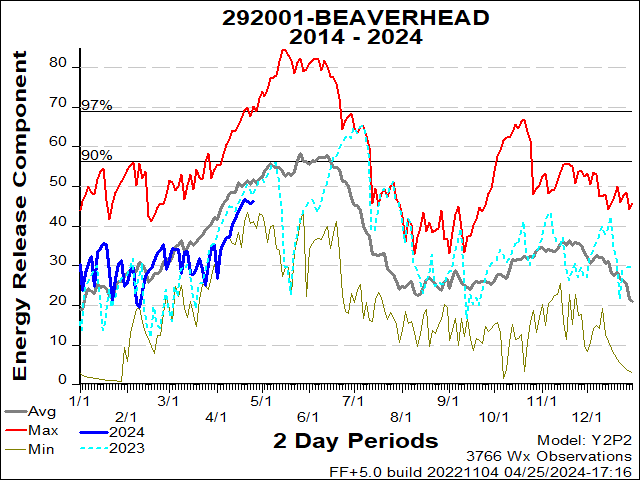
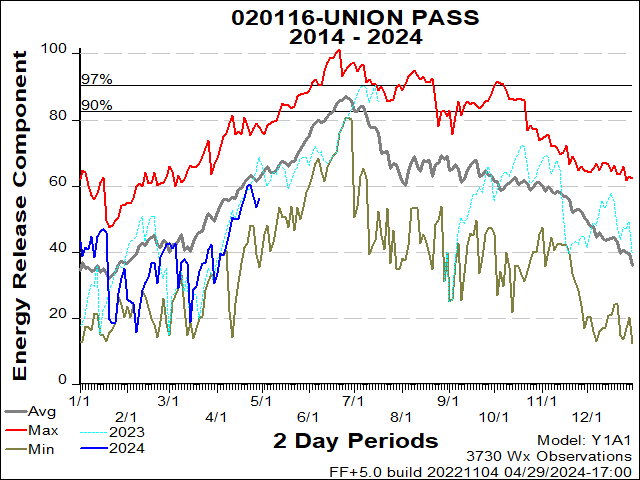
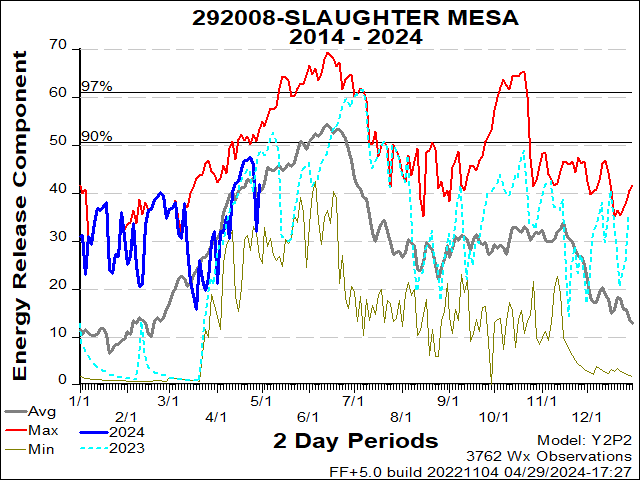
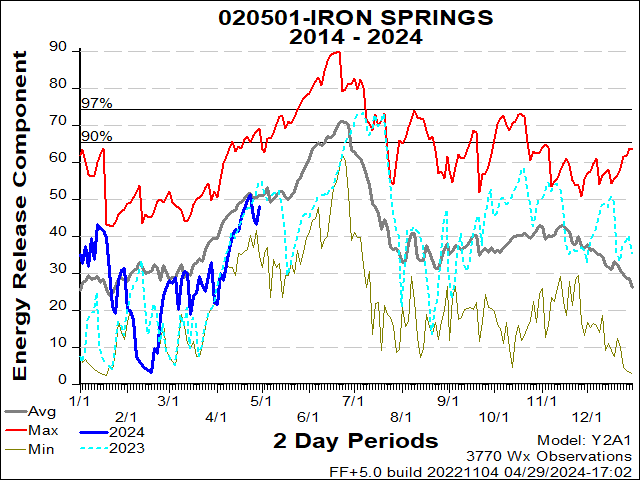
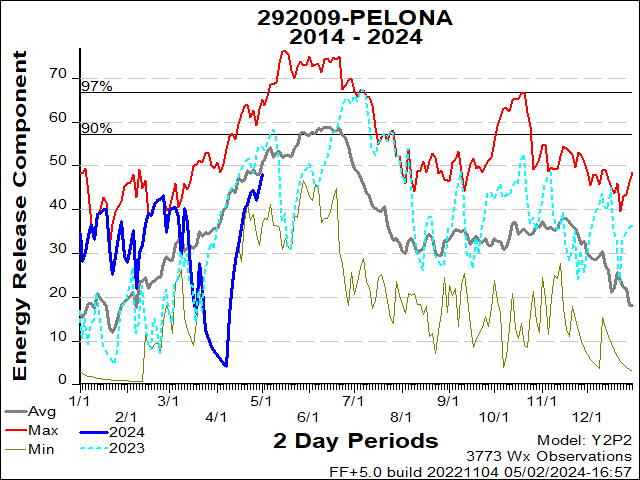
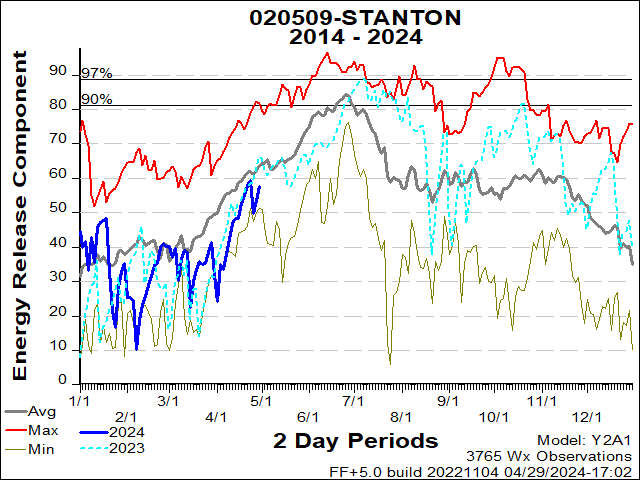
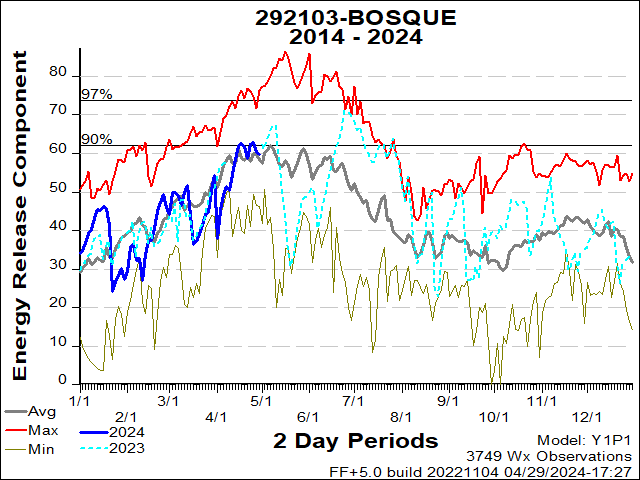
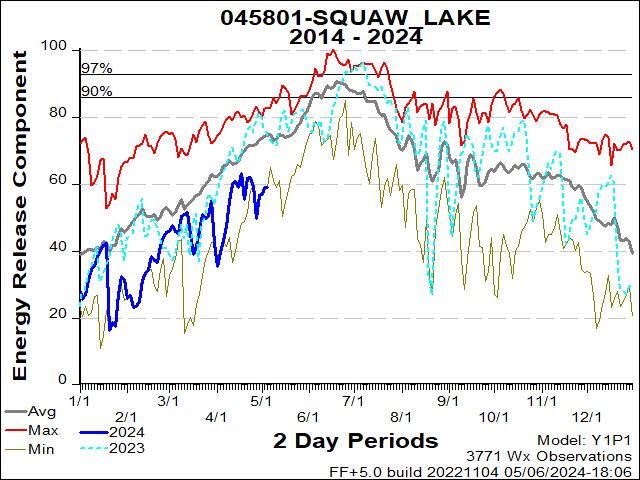
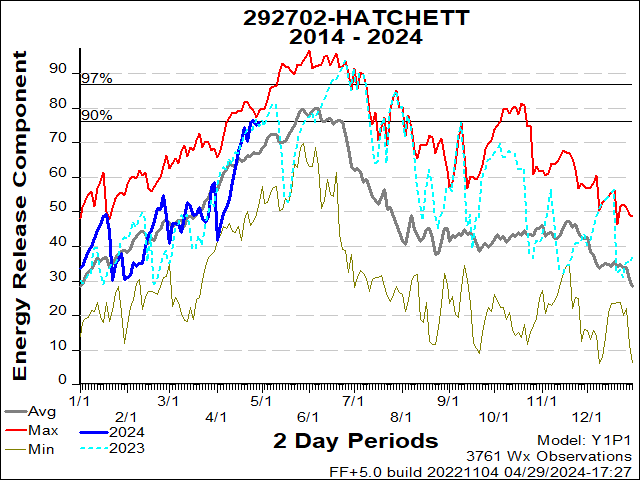
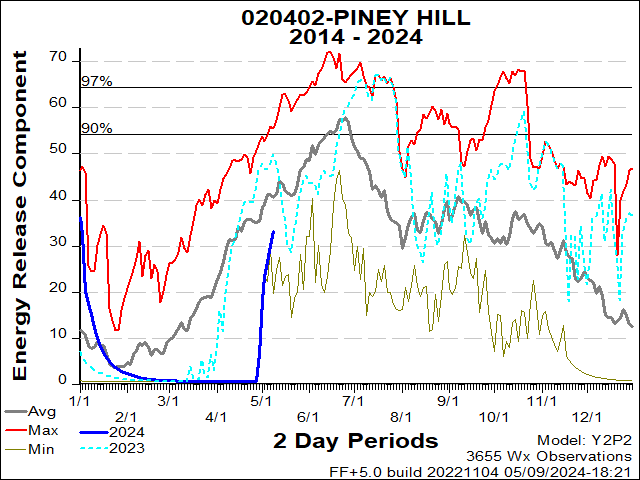
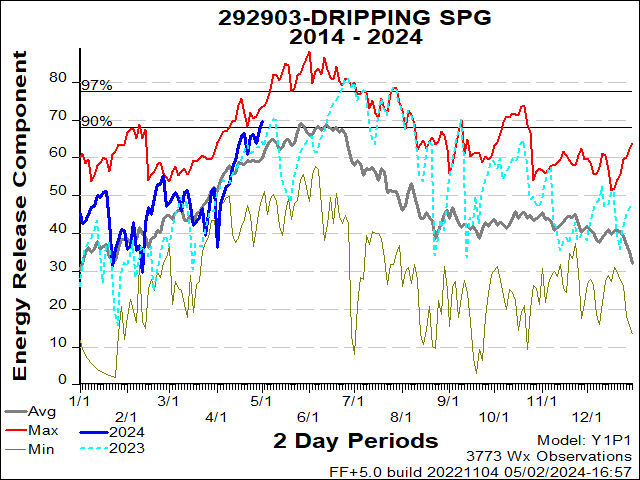
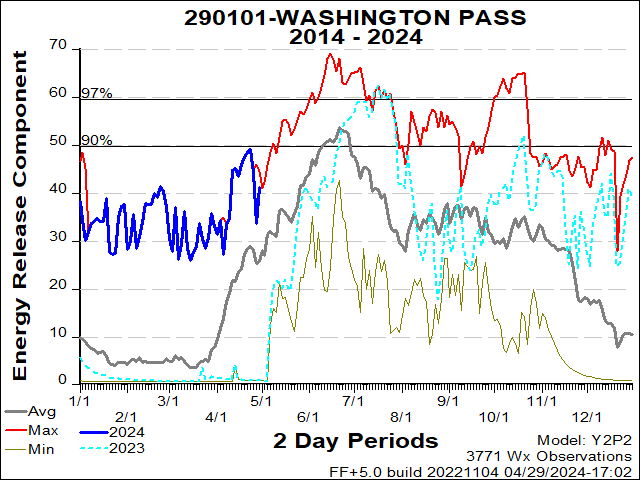
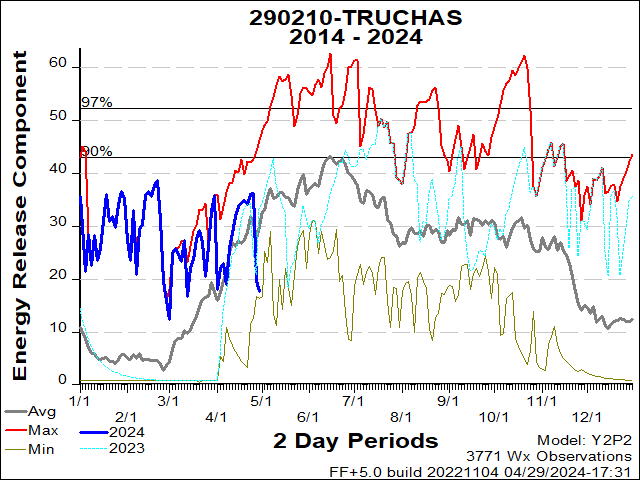
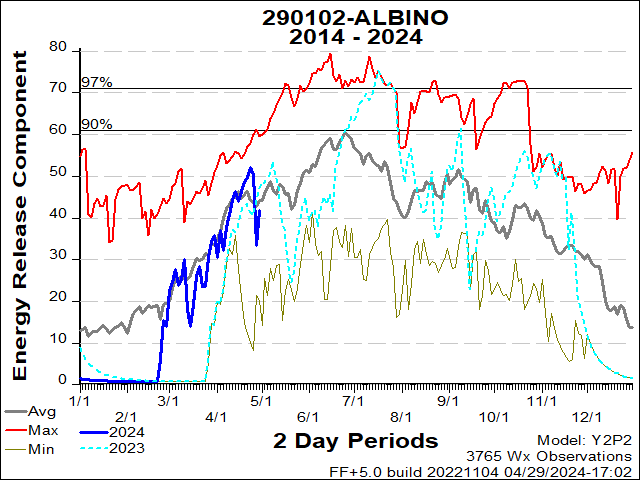
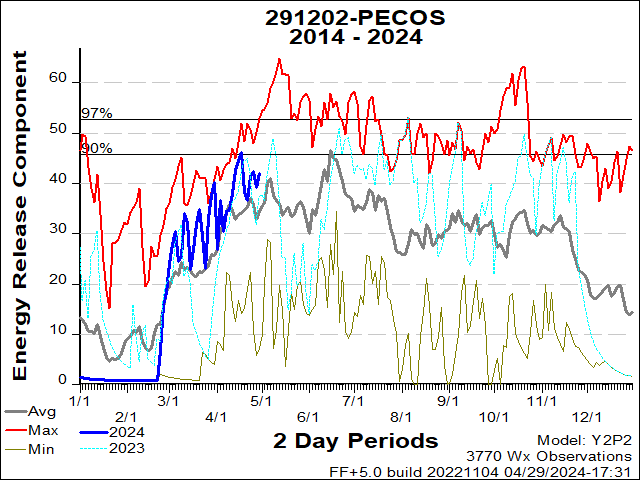
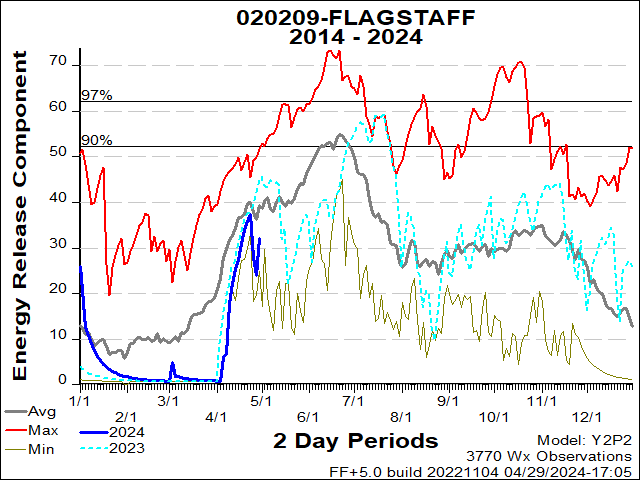
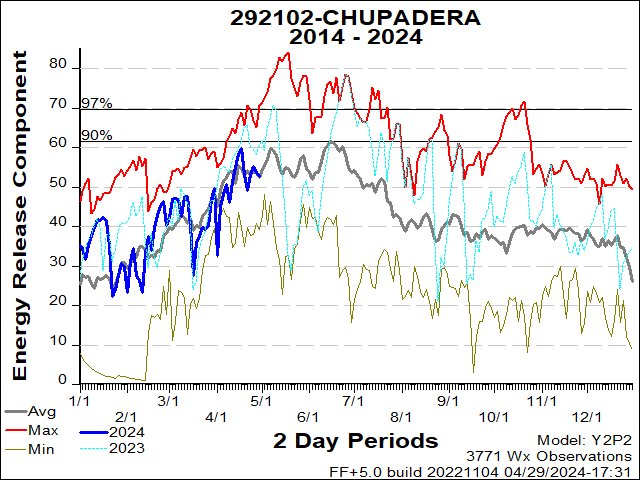
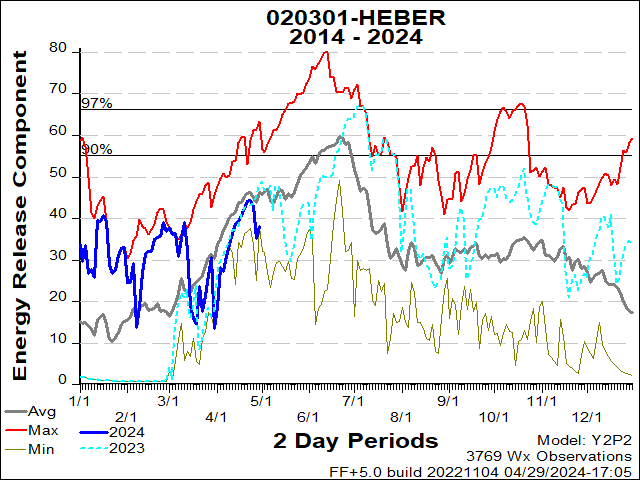
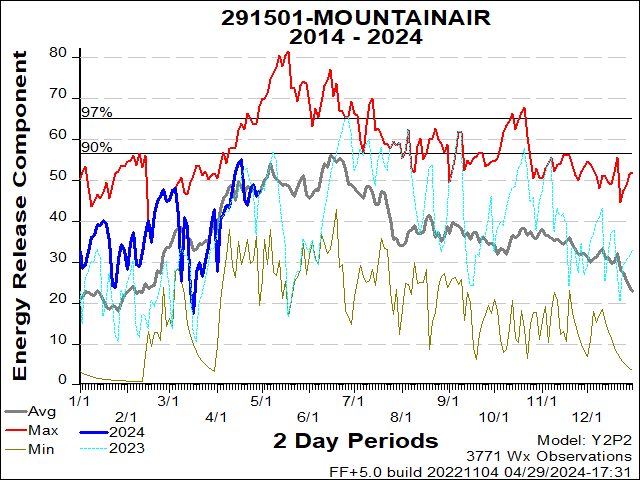
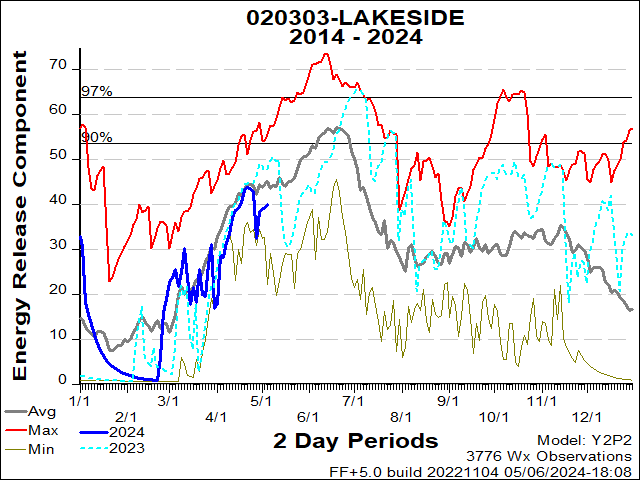
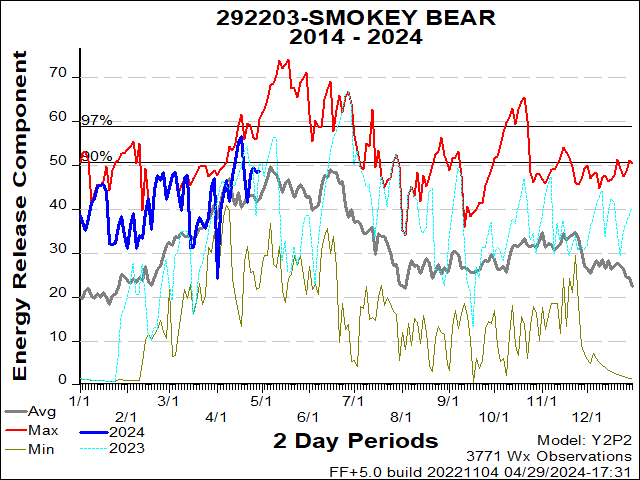
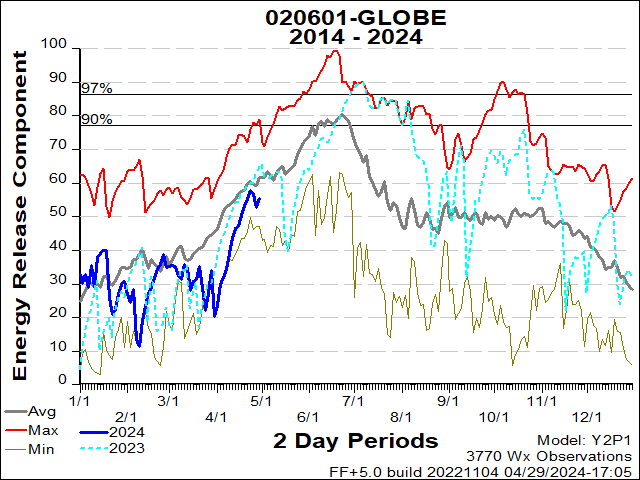
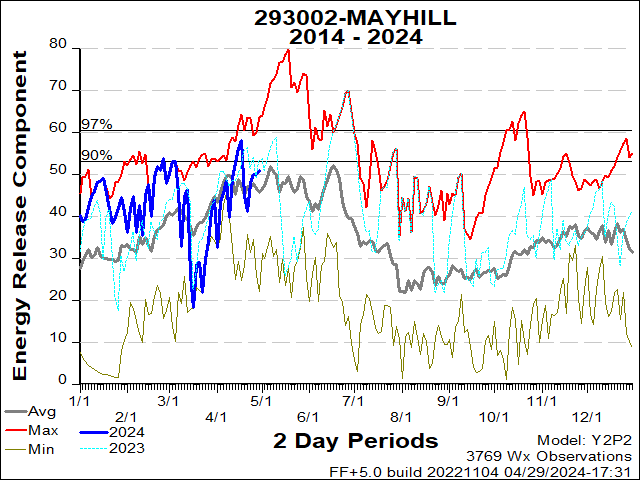
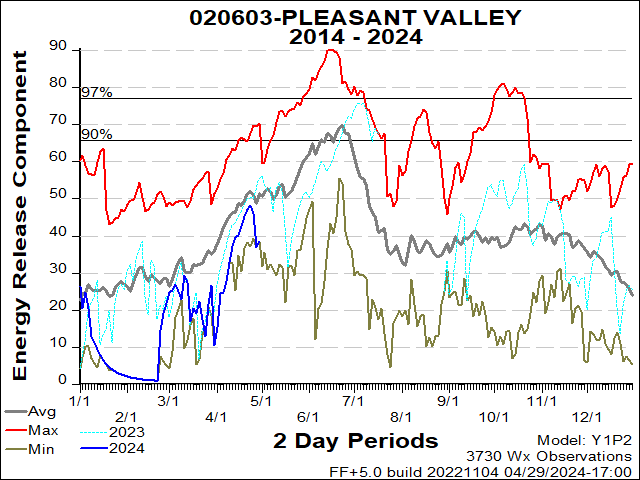
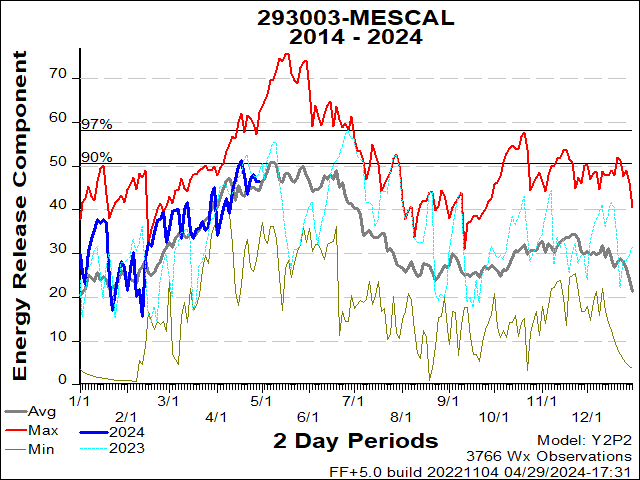
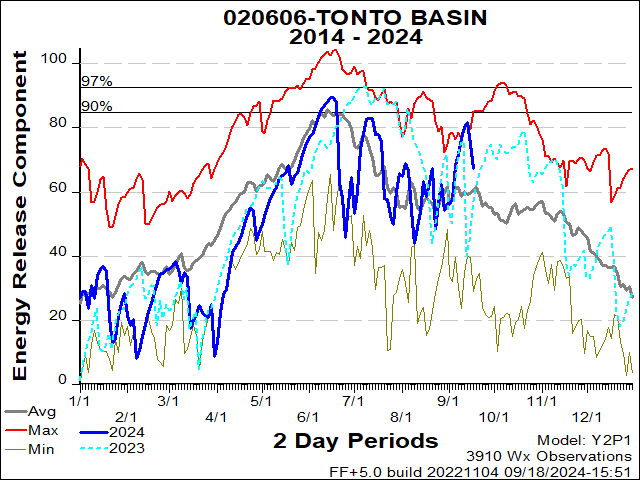
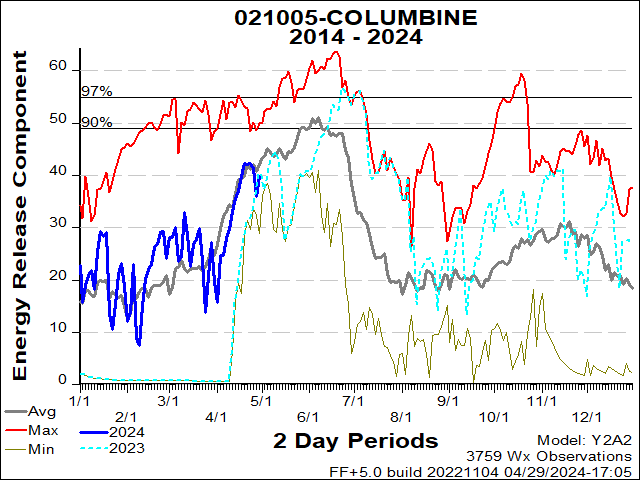
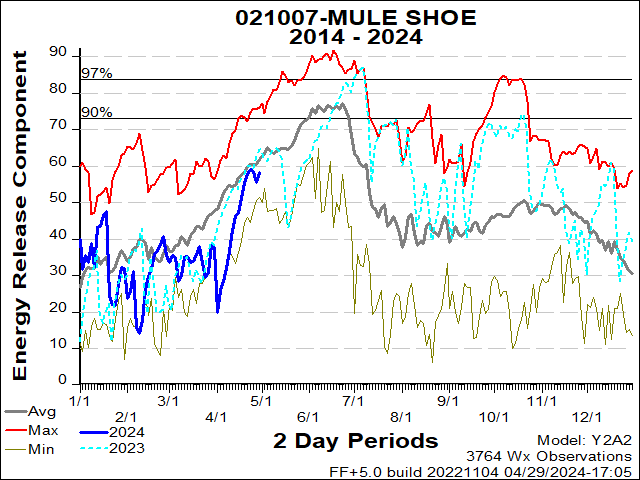
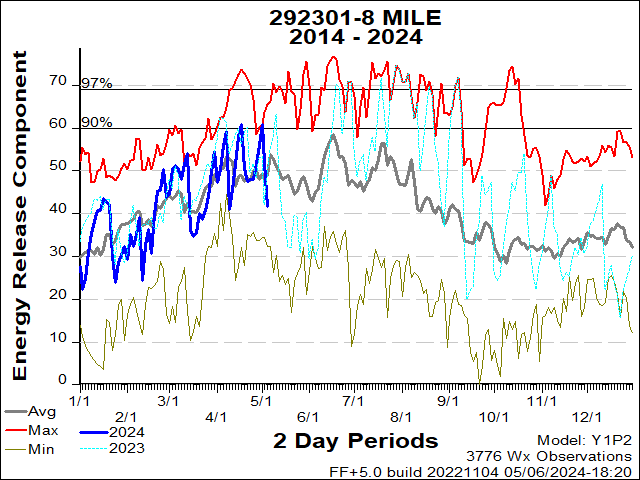
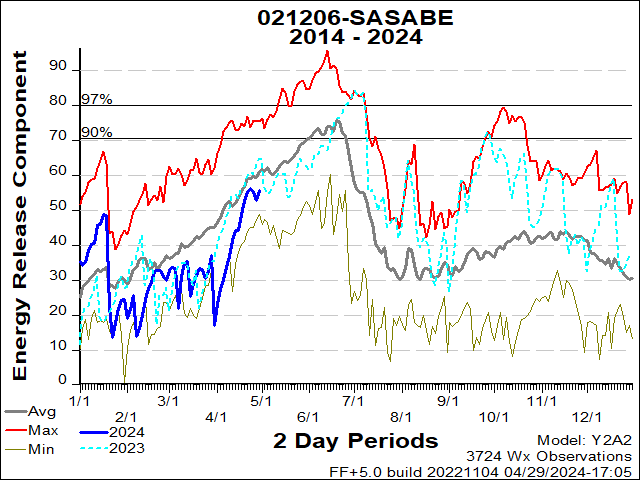
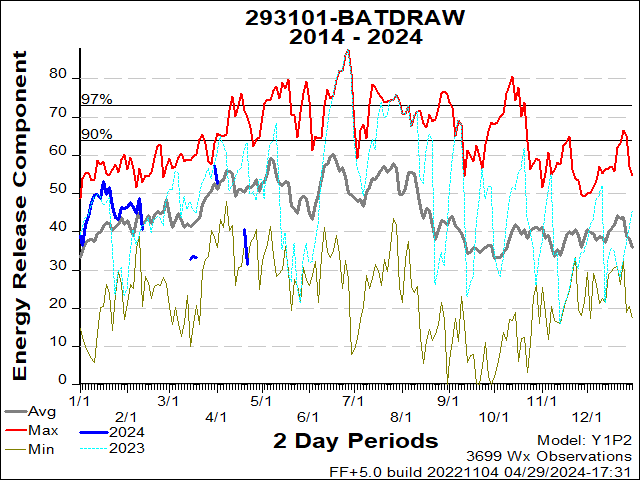
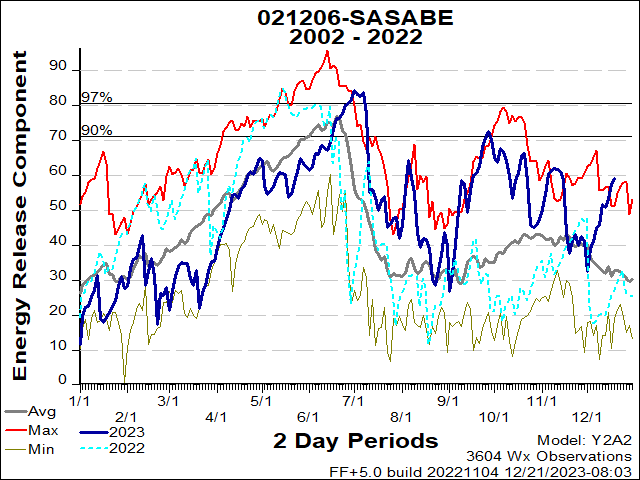
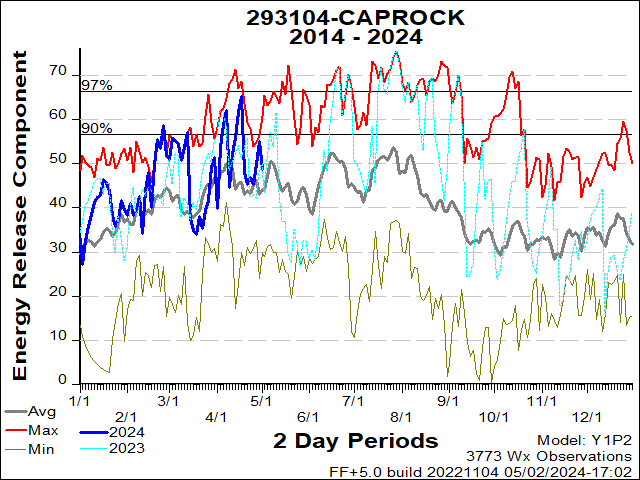
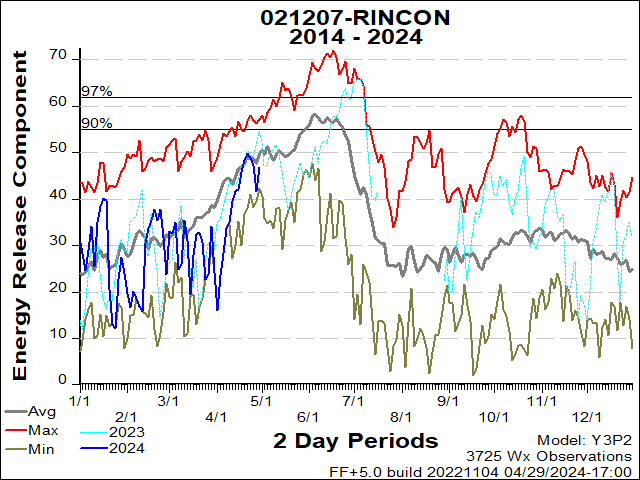
2. 2-DAY MOVING AVERAGE ERC CHARTS - INDIVIDUAL STATION CHARTS
Click on Orange Button below to view ERC Chart for the station. *Please note that the image links do not always work on mobile browsers, a replacement is under development, in the meanwhile select the deisred weather station from the table below as necessary.
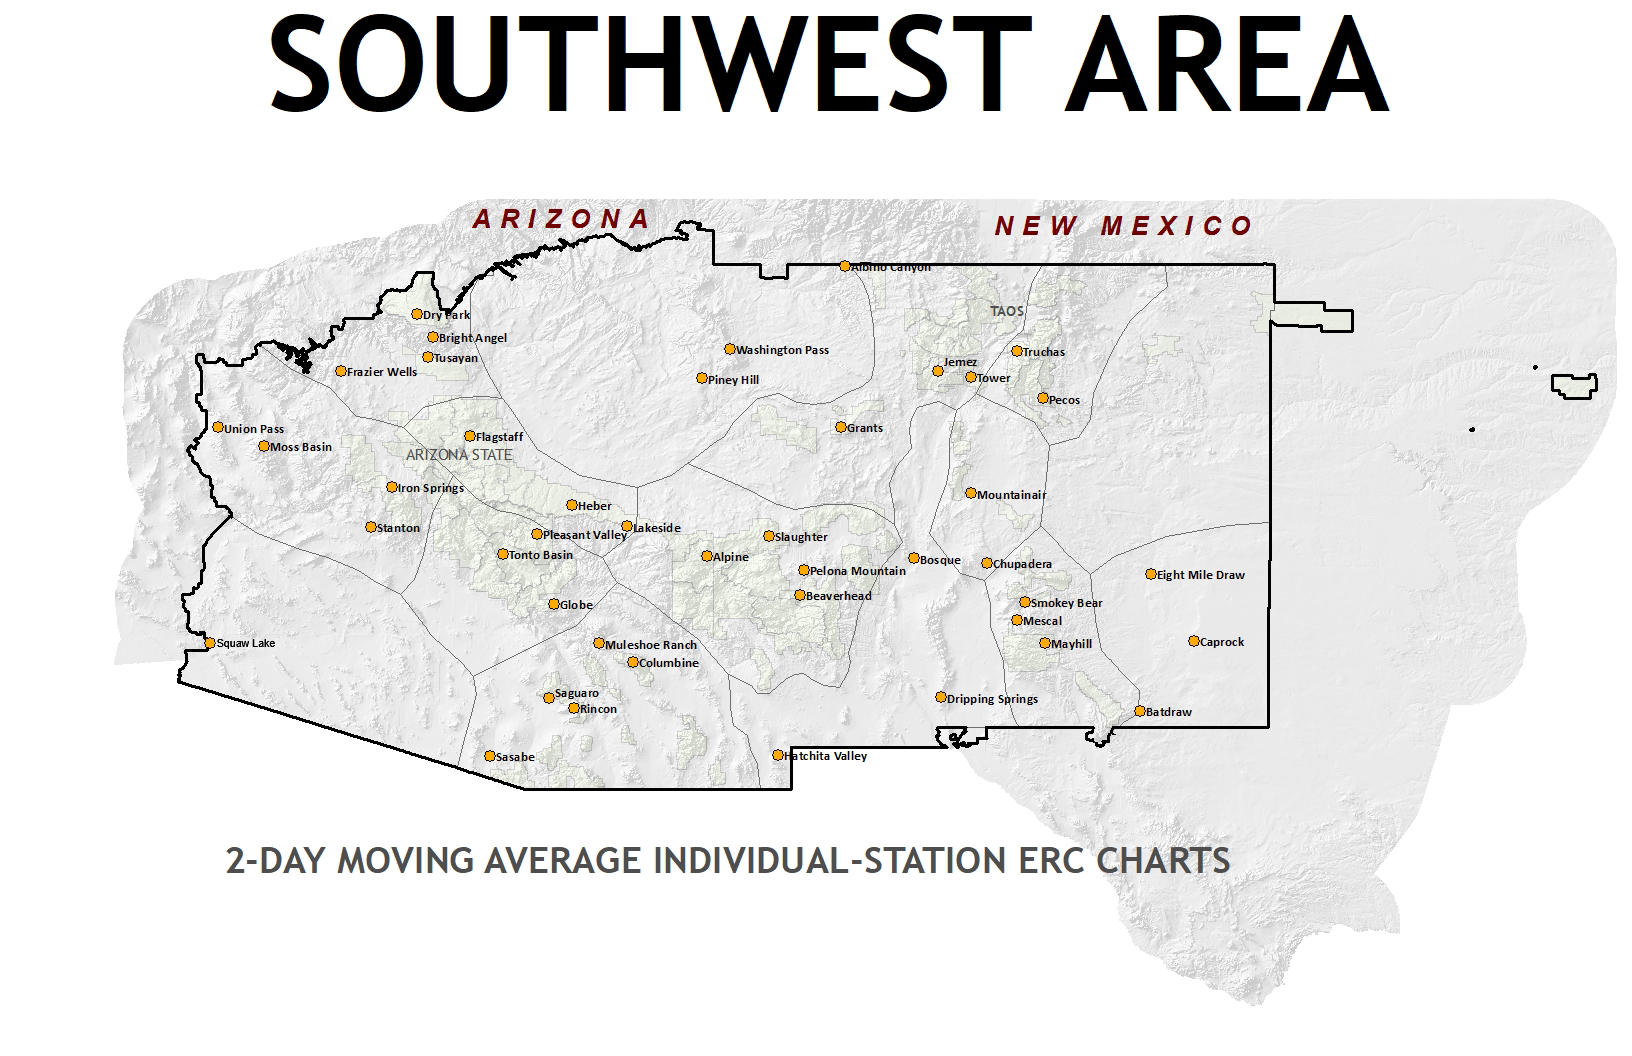
| PSA | STATION NUMBER | STATION NAME (AGENCY - UNIT) | PSA | STATION NUMBER | STATION NAME (AGENCY - UNIT) |
|---|---|---|---|---|---|
| 1 | 20207 | Tusayan (USFS - KNF) | 7 | 290702 | Jemez (USFS - SNF) |
| 20211 | Bright Angel (NPS - GCP) | 290801 | Tower (NPS - BAP) | ||
| 20212 | Drypark (USFS - KNF) | 291302 | Grants (USFS - CIF) | ||
| 20213 | Frazier Well (BIA - TCA) | 8 | 20401 | Alpine (USFS - ASF) | |
| 2 | 20115 | Moss Basin (BLM - KFO) | 292001 | Beaverhead (USFS - GNF) | |
| 20116 | Union Pass (BLM - KFO) | 292008 | Slaughter Mesa (USFS - GNF) | ||
| 20501 | Iron Springs (USFS - PNF) | 292009 | Pelona Mtn (BLM - SCD) | ||
| 20509 | Stanton (BLM - PHD) | 9 | 292103 | Bosque (FWS - BDR) | |
| 3 | 45801 | Squaw Lake (FWS - IMR) | 292702 | Hatchett (BLM - LCD) | |
| 4 | 20402 | Piney Hill (BIA - NAA) | 292903 | Dripping Springs (BLM - LCD) | |
| 290101 | Washington Pass (BIA - NAA) | 10 | 290210 | Truchas (USFS - CAF) | |
| 290102 | Albino Canyon (BLM - FAD) | 291202 | Pecos (USFS - SNF) | ||
| 5 | 20209 | Flagstaff (USFS - COF) | 11 | 292102 | Chupadera (BLM - LCD) |
| 20301 | Heber (USFS - ASF) | 291501 | Mountainair (USFS - CIF) | ||
| 20303 | Lakeside (USFS - ASF) | 12 | 292203 | Smokey Bear (USFS - LNF) | |
| 6N | 20601 | Globe (USFS - TNF) | 293002 | Mayhill (USFS - LNF) | |
| 20603 | Pleasant Valley (USFS - TNF) | 293003 | Mescal (BIA - MEA) | ||
| 20606 | Tonto Basin (USFS - TNF) | ||||
| 6S | 21005 | Columbine (USFS - CNF) | 13 | ||
| 21007 | Mule Shoe (BLM - GID) | 14 | 292301 | Eight Mile Draw (BLM - ROD) | |
| 21202 | Saguaro (USFS - CNF) | 293101 | Batdraw (NPS - CCP) | ||
| 21206 | Sasabe (FWS - BAR) | 293104 | Caprock (BLM - ROD) | ||
| 21207 | Rincon (NPS - SAP) | ||||
** Charts are created using Fuel Model Y as the representative model and posted Weekly during PL 1, twice a week during PL 2, and thrice a week in PL 3 - 5.
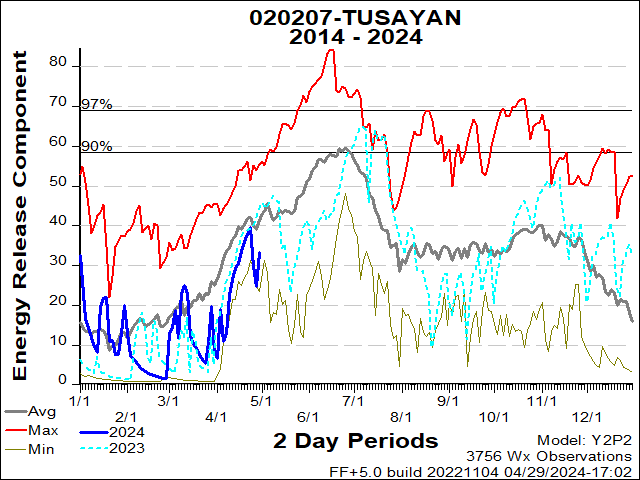
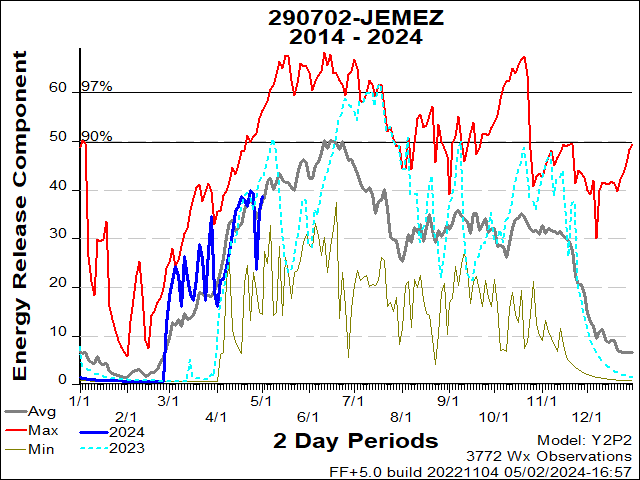
What is the Energy Release Component (ERC)?
The Energy Release Component (ERC) is based on the estimated potential available energy released per unit area in the flaming front of a fire. The day-to-day variations of the ERC are caused by changes in the moisture contents of the various fuel classes, including the 1,000 hour timelag class.
The ERC is derived from predictions of
- the rate of heat release per unit area during flaming combustion and
- the duration of flaming.
How are the Graphs used?
All wildland protection agencies are directed to protect life, property, and natural resources entrusted to them. These requirements dictate strict attention be paid to the availability and use of suppression resources. In the Southwest Area, the Graphs are averaged over 2-day periods. They are primarily used to look at the seasonal trends, a comparison tool against previous years, and as one tool used in determining the Area preparedness level. Each chart displays the current year BI or ERC values relative to the average for a 25-year period, the average of the highest values during the same period, and when the values reach the 90th and 97th percentiles. The Graphs are not designed to be site specific, they provide only a general picture of how conditions are currently and how the season is progressing in the Southwest. Units throughout the SWA produce their own local, site specific chart(s).
The Graphs are only one of the components used in determining the SWA preparedness level. Other components that must be considered include; (1) current and long range forecasted weather affecting current and forecasted fire behavior/potential, (2) resource committments to incidents, (3) individual agency fire reports, (4) National Preparedness Level, (5) air quality considerations, and (6) fire suppression resource availability. The breakpoints in which the ERC Curve is used to assist in determining the area preparedness level are indicated by lines drawn horizontally (i.e. PL-2, PL-3, PL-4) on the chart. The 90th corresponds to the "very high" adjective reading and the 97th percentile corresponds to the "extreme" adjective reading.
Archive
- SOUTHWEST COORDINATION CENTER
- 333 Broadway SE
- Albuquerque, NM 87102