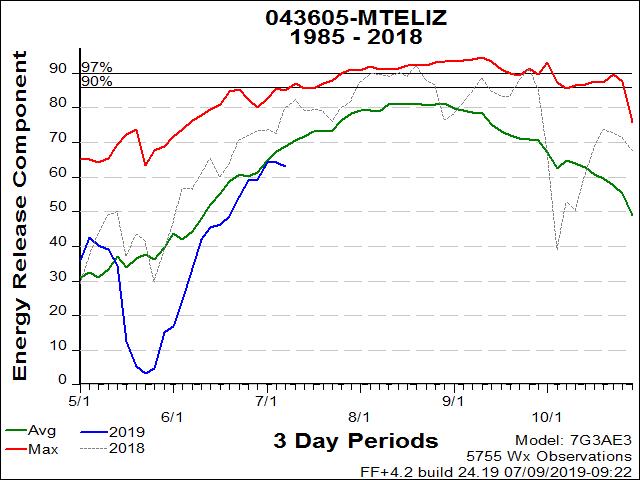
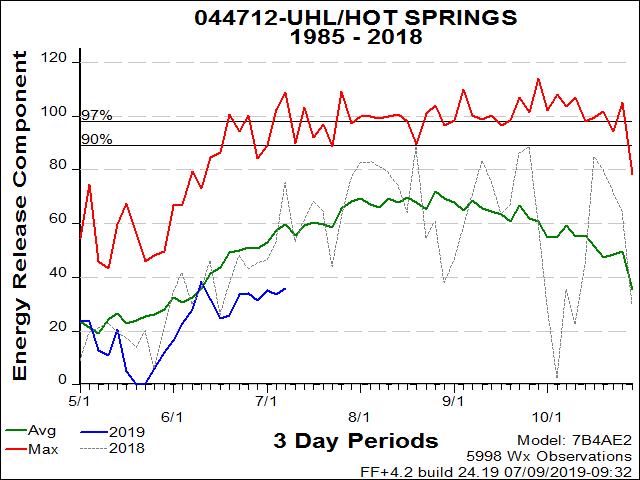
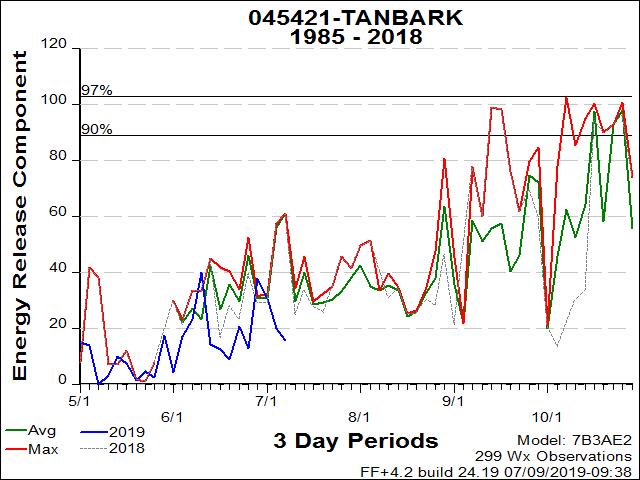
The Energy Release Component (ERC) is an NFDRS (National Fire Danger Rating System)
index related to how hot a fire could burn. It is directly related
to the 24-hour, potential worst case, total available energy (BTUs)
per unit area (in square feet) within the flaming front at the
head of a fire.
The ERC can serve as a good characterization
of fire season as it tracks seasonal fire danger trends well.
The ERC is a function of the fuel model and live and dead fuel
moistures. Fuel loading, woody fuel moistures, and larger fuel
moistures all have an influence on the ERC, while the lighter
fuels have less influence and wind speed has none. ERC has low
variability, and is the best fire danger component for indicating
the effects of intermediate to long-term drying on fire behavior
(if it is a significant factor) although it is not intended for
use as a drought index.
Charts from each Forest Service year around weather
station are arranged generally from the northern part of the Geographic
Area to the southern part. Year around stations are those weather
stations which represent the fire danger conditions on the Forest
Unit, and most stations contain at least twenty years of historical
weather data. Data collected prior to 1976 is not used in these
analyses due to an issue with the relative humidity measurements
before that time.
Winter conditions of snow covered fuels require
that the ERC and fuel moisture graphs be temporarily discontinued.
The graphs for this page are generated by FireFamily Plus. Weather
station data imported into FireFamily Plus during the months of
snow covered fuels does not contain all required information to
generate accurate NFDRS outputs. This is due to missing Wet Fuels
flag information in the imported FWX data and the FireFamily Plus
program not being programmed to utilize the information imported
using the FW9 format. Accurate values can be obtained from the
Weather Information Management System (WIMS) - if the daily observation
represents the snow covered fuels by properly “forcing”
the Wet Fuels flag entry.
Most recent update:
Monday, 7/8/2019.